It was a Thursday in late September, and GBPUSD had just dropped 96 pips in three hours. I watched a big green candle print right at the lows, felt that familiar rush of “the bottom is in,” and bought at 1.2648 without waiting for the candle to close. Twenty minutes later price faded back through the lows, my stop went at 1.2623, and I was -$410 poorer with nothing to show except a lesson I should have learned months earlier.
In this article
The next week the same shape appeared. This time I waited. The green candle closed — and it closed above the exact midpoint of the red candle before it. That single detail turned a gamble into a plan: I bought the break of the piercing candle’s high, put my stop below the pattern low, and rode it for +2.1R. Same pair, same downtrend, same green candle energy. The only difference was the midpoint test.
That is what this article is about. The piercing pattern is one of the oldest two-candle reversals in technical analysis, but on a funded account it is only tradeable if you run it through strict rules. Here is my full 5-rule plan: the setup, the entry, the stop, the target, the session filter — plus the position-sizing maths that keep every trade at 0.5% risk so a string of losers can never touch your daily loss limit.
What the piercing pattern actually is
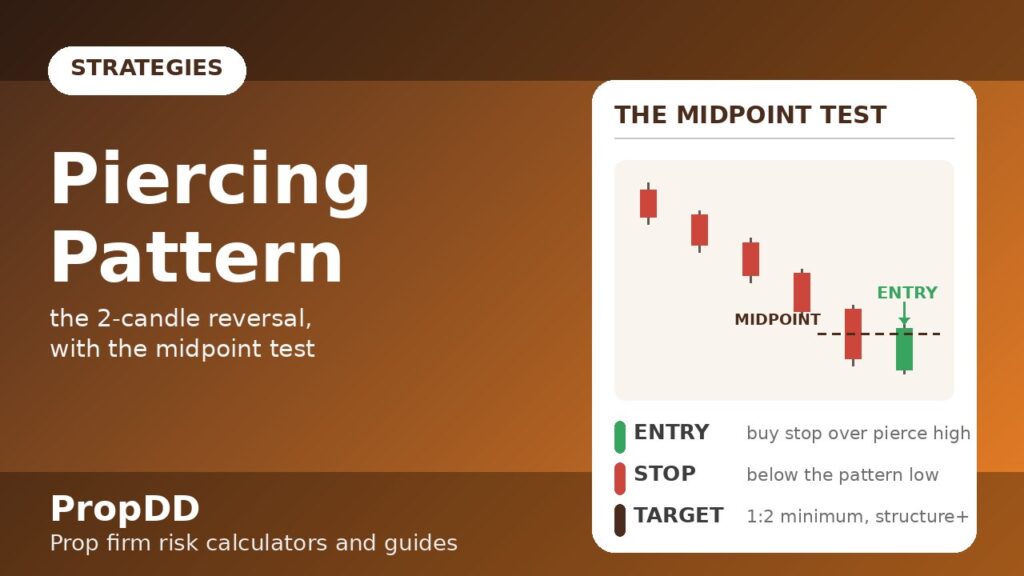
A piercing pattern is a two-candle bullish reversal that forms at the bottom of a clear downtrend. The first candle is a long red candle that closes near its low — sellers in full control. The second candle opens below the first candle’s close (ideally below its low), then buyers step in and drive price up to close above the midpoint of the first candle’s body. That midpoint close is the whole pattern. Without it, you do not have a piercing pattern — you just have a green candle, and green candles after selloffs fail constantly. (If you want the textbook anatomy cross-checked, PriceActionNinja’s piercing line pattern guide lays out the same checklist I use: downtrend, long red candle, open below the low, close above the midpoint.)
Why does the midpoint matter so much? Because it measures conviction. A second candle that closes at 30% of the first candle’s body shows buyers tried and stalled. One that closes above the midpoint shows buyers reclaimed more than half of what sellers took — a genuine shift in the order flow, not a dead-cat bounce. On a funded account, where every entry has to justify its risk against a hard daily limit, that distinction is the difference between a plan and a hope.
| Element | What I need to see | Why it matters |
|---|---|---|
| Prior trend | A clear downtrend: lower highs and lower lows over at least 8–12 candles | Without a trend to reverse, the pattern has no predictive value |
| Candle 1 | Long red body, closes near its low | Shows sellers were in control right up to the reversal attempt |
| Candle 2 open | Opens below candle 1’s close, ideally below its low | The gap down shakes out weak longs, then buyers take over |
| Candle 2 close | Closes above the 50% midpoint of candle 1’s body | The filter: proves buyers reclaimed the majority of the range |
| Location | At or near a support level, demand zone or round number | Confluence turns a 50/50 pattern into a tradeable edge |
The 5-rule piercing plan
Here are my exact rules. I wrote them on an index card after that -$410 Thursday, and I have not taken a piercing-pattern trade off-card since.
| Rule | The rule | My notes |
|---|---|---|
| 1. Setup | Downtrend + piercing pattern at support — never mid-range | I skip patterns floating in the middle of nowhere; they fail twice as often in my log |
| 2. Entry | Buy stop 2–3 pips above candle 2’s high | The stop order means I am only filled if buyers follow through — no anticipating |
| 3. Stop loss | Below the pattern low (the lower of the two candles’ lows), plus a 5–10 pip buffer | Objective and tight: if price takes out both lows, the reversal thesis is dead |
| 4. Take profit | Minimum 1:2 risk-to-reward; structure target at the nearest resistance | I take half at 1:2 and trail the rest — banked profit protects the daily number |
| 5. Session filter | London and New York sessions only; nothing 30 minutes either side of red news | Asian-session patterns chop; news spikes invalidate every candle signal |
Rule 2 deserves emphasis: the buy stop above candle 2’s high is what makes this a strategy instead of a guess. If the reversal is real, price trades through the piercing high and fills me. If it is a fakeout, my order simply never fills and I lose nothing — the cheapest outcome in trading.
The 0.5%-risk sizing maths
Reversal patterns are seductive because the stops are small, and small stops tempt traders into oversized positions. On a funded account that is exactly backwards: the smaller the stop, the more carefully you size, because three quick losers at 1% each still eat 60% of a 5% daily limit. My fixed rule is 0.5% of the account per piercing-pattern trade — no exceptions, no “this one looks perfect” upgrades.
Position-size formula
Lots = Risk ($) ÷ (Stop distance in pips × Pip value per standard lot)
| Step | My worked GBPUSD example |
|---|---|
| Account and risk | $100,000 account × 0.5% = $500 maximum loss on the trade |
| Entry and stop | Buy stop at 1.2640 (above the piercing high); stop at 1.2615 (below the pattern low) = 25 pips |
| Pip value | $10 per pip per standard lot on GBPUSD |
| Position size | $500 ÷ (25 × $10) = 2.0 standard lots |
| Target | Nearest resistance at 1.2700 = 60 pips = 2.4R |
| Outcomes | Win: +$1,200 (+1.2% on the account). Loss: −$500 (−0.5%, just 10% of a 5% daily limit) |
Before I place the order I run the numbers through the max daily drawdown calculator to confirm the planned loss keeps me comfortably inside the day’s remaining allowance — especially if I already have an open position or an earlier loss on the book.
When I trade it: sessions, pairs and the news blackout
The piercing pattern is a momentum-handoff pattern: sellers exhaust, buyers seize control. That handoff needs real order flow behind it, which is why session selection is rule 5 and not a footnote. Here is my routine:
| Window | How I treat piercing patterns |
|---|---|
| London open, 07:00–10:00 GMT | Prime time — the deepest liquidity and the cleanest reversals in my log |
| New York morning, 12:00–15:00 GMT | Second best; US data can supercharge the reversal — or invalidate it, hence the news blackout |
| Asian session | Skipped entirely — thin ranges produce piercing-looking candles that mean nothing |
| 30 minutes around red news | Never — a CPI or NFP spike will pierce straight through any pattern (see the news trading guide for why) |
For pairs I stick to GBPUSD and EURUSD on the H1 and H4 timeframes, where the pattern has room to breathe and stops sit at honest levels. On XAUUSD the same rules apply but the pip maths change — I size gold positions with the XAUUSD lot size calculator rather than guessing the contract value. Lower timeframes (M15 and below) print piercing patterns constantly, but the stops are so tight that spread and wick noise eat the edge; I leave those to other traders.
I tested it: 10 piercing patterns on a $100k demo
Over three weeks I logged every piercing pattern that met all five rules on a $100,000 demo, risking $500 (0.5%) per trade. Two patterns I spotted in the Asian session I logged but did not trade under the current rules — both lost, which is exactly why rule 5 exists. Here is the trade-by-trade record:
| # | Pair | Session | Entry | Stop | Result |
|---|---|---|---|---|---|
| 1 | GBPUSD | London | 1.2640 | 1.2615 (25 pips) | +2.1R |
| 2 | EURUSD | New York | 1.0832 | 1.0812 (20 pips) | -1.0R |
| 3 | XAUUSD | London | 2384.2 | 2379.4 ($4.80) | +2.6R |
| 4 | GBPUSD | London | 1.2571 | 1.2546 (25 pips) | +1.8R |
| 5 | EURUSD | London | 1.0790 | 1.0768 (22 pips) | -1.0R |
| 6 | US30 | New York | 42150 | 42060 (90 pts) | -1.0R |
| 7 | GBPUSD | New York | 1.2498 | 1.2473 (25 pips) | +2.3R |
| 8 | EURUSD | London | 1.0715 | 1.0695 (20 pips) | +1.5R |
| 9 | XAUUSD | New York | 2401.5 | 2396.0 ($5.50) | -1.0R |
| 10 | GBPUSD | London | 1.2440 | 1.2418 (22 pips) | +2.0R |
The final tally: 6 wins, 4 losses (60% win rate), average winner +2.05R, net +8.3R — about +$4,150 at $500 risk per trade. The losing trades all behaved: each cost exactly the planned $500, and the worst single day was −$1,000, a fifth of a typical 5% daily limit. I also ran the 60% win rate with a 2.05:1 average payoff through the risk of ruin calculator — the ruin probability at 0.5% risk per trade sits well under 1%, which is the real reason this strategy fits a funded account: the maths survives even when the market does not cooperate for a week.
When the piercing pattern fails
Four of my ten logged trades lost, and every loss taught the same lesson: the pattern fails in predictable ways, and each way has a rule-shaped fix. If you are going to trade this on a funded account, memorise the failure list, not just the setup.
| Failure mode | What it looks like | The fix |
|---|---|---|
| No real downtrend | Two candles print mid-range after sideways chop | Require lower highs and lower lows first — no trend, no trade |
| Weak close | Second candle closes green but below the midpoint | Not a piercing pattern at all — walk away, however tempting the green looks |
| Red-news spike | Pattern completes into CPI, NFP or a central-bank decision | Rule 5: flat 30 minutes either side, no exceptions |
| Too-small candles | A 12-pip “pattern” on GBPUSD with a 9-pip stop | Demand real range — stops inside the spread noise get hunted by design |
| Chasing the entry | Price runs 40+ pips past the piercing high before you enter | If the entry is gone, the R:R is gone — skip it and wait for the next one |
How it fits prop firm rules
The reason I keep coming back to the piercing pattern on funded accounts is structural, not emotional. First, the stop is objective and small — the pattern low — so risk stays at 0.5% without any discretion about “where to put the stop.” Three straight losers cost 1.5%, which a 5% daily loss limit absorbs without a flicker. Second, valid patterns are scarce: two or three a week across my pairs, which keeps trade frequency low and keeps the consistency rule happy — no single day can dominate my P&L when I only take a handful of trades. Third, the news blackout in rule 5 doubles as compliance with the news-trading restrictions most firms publish. And because the entry is a resting buy stop, I am never staring at the screen willing a candle to close — I set my personal daily stop below the firm limit, place the order, and let the plan work or fail on its own terms.
If you trade other reversal patterns, the piercing pattern pairs naturally with the engulfing pattern strategy (a stronger, full-body variant of the same idea) and the pin bar reversal strategy — all three share the same 0.5%-risk sizing and the same session filter, so they stack into one coherent reversal playbook instead of three conflicting systems.
Piercing pattern FAQs
What is the piercing pattern in trading?
It is a two-candle bullish reversal pattern. After a clear downtrend, a long red candle is followed by a green candle that opens lower but rallies to close above the midpoint of the red candle’s body — signalling that buyers have seized control from sellers.
Does the second candle have to close above the midpoint?
Yes — that is the defining test. A green second candle that closes below the midpoint is not a piercing pattern; it shows buyers tried but failed to reclaim the range. I skip those entirely, no matter how bullish the candle looks.
What is the difference between the piercing pattern and the engulfing pattern?
An engulfing pattern’s second candle swallows the entire body of the first candle, while a piercing pattern’s second candle only needs to close above its midpoint. Engulfing is the stronger signal, but piercing patterns appear more often and offer tighter stops — I trade both with the same risk rules (see my engulfing pattern guide).
What timeframe works best for the piercing pattern on a funded account?
H1 and H4. The pattern prints constantly on M15 and below, but the stops are so tight that spread and wick noise destroy the edge. Higher timeframes give honest stop placement and 2R+ targets that justify the risk.
Can I trade the piercing pattern during news?
No — not on a funded account. Red-news spikes invalidate every candle signal and most firms restrict news trading anyway. My rule is flat 30 minutes either side of high-impact releases.
What win rate does the piercing pattern need to be profitable?
With a 2:1 average reward-to-risk, you only need to win about one trade in three to break even. My logged sample ran at 60% with a 2.05:1 average payoff, which is comfortably profitable — but the small 0.5% risk per trade is what makes the inevitable losing streaks survivable.
Risk disclaimer: Trading involves substantial risk of loss. Past pattern performance — including the demo results in this article — does not guarantee future results. Never risk money you cannot afford to lose, and always follow your prop firm’s published rules.




1 comment
[…] the wheel and drive it back through half of the bulls’ gains. It is the bearish mirror of the piercing pattern, where the second candle rises instead of […]