I lost 500 dollars in one afternoon because I shorted the wrong zone. EURUSD had dropped hard through a swing low, then pulled back into a shaded rectangle on my chart, and I sold it, confident the zone would hold. It did not hold. Price sailed straight through, stopped me out, and kept going, and when I looked again I realised the rectangle I had drawn was an old order block from two days earlier, already tested twice, already spent. The zone that actually mattered was one candle wide, sitting right at the top of the drop, and price had never touched it since the break. That candle was a mitigation block, and learning the difference between it and an order block changed the way I trade pullbacks on a funded account. An order block is a zone you watch. A mitigation block is a zone you trade once, on its first return, and then forget, because after the first touch it is either proven or dead.
In this article
- What a mitigation block actually is
- Mitigation block versus order block: the difference that decides the trade
- How to mark a mitigation block, step by step
- The six rules I trade by
- The worked trade: entry, stop and targets on EURUSD
- Position sizing under a daily loss limit
- When the strategy fails
- The five-trade log and the filter test
- My daily routine for mitigation blocks
- Frequently asked questions
Every number in this guide uses the same account as the rest of this series: a 100,000-dollar funded account, a 5,000-dollar firm daily loss limit, and a personal daily stop of 1,000 dollars. I risk 500 dollars per trade, 0.5 percent of the account. If two trades stop out, my day is over at minus 1,000 dollars, with 4,000 dollars of firm headroom untouched. That buffer is the point: the sizing has to survive the losing days, not just celebrate the winning ones.
What a mitigation block actually is
A mitigation block is the last candle that moved against the break, immediately before price displaced strongly through a key level. In a bearish example, price grinds up, prints one final up candle, and then drops hard through the swing low below it. That final up candle is the bearish mitigation block. The idea behind it, in Smart Money Concepts language, is that the orders which created that last up candle were never fully filled before price ran away downward, so when price returns to that candle’s range, those orders get mitigated, filled, and price turns back down. The beginner’s guide to mitigation blocks makes the same point in plainer terms: a mitigation block is a price area traders monitor after a strong directional move, and it only becomes meaningful when price actually revisits it. I agree with that framing and I would go further on a funded account: it is only meaningful on the first revisit. A zone that has already been revisited has already done its mitigating, and trading it a second time is trading a memory.
Three conditions have to be true before I even draw the rectangle. First, there must be a genuine break of structure: price must close through a swing high or swing low that mattered, not just wick past it. Second, the displacement after the break must be strong, a run of candles in one direction with little overlap, because a slow drift does not leave unfilled orders behind it. Third, the mitigation candle itself must be the last candle against the move, not a candle chosen from the middle of the run because it looks convenient. If any of those three is missing, I do not have a mitigation block, I have a rectangle I drew because I wanted a trade, and funded accounts punish wanted trades more reliably than any other kind.
Mitigation block versus order block: the difference that decides the trade
This is the section the whole strategy stands on, because the site already has a full order block strategy guide, and the two ideas look alike on a chart. They are not the same trade. An order block is the last opposing candle before a move in the general sense, a zone formed by institutional buying or selling, and it can be traded on a return whenever it is still fresh and untested. A mitigation block is narrower and stricter: it is specifically the last candle before a break of structure, and its whole logic is the first return to fill what the displacement left behind. The order block article teaches mitigation rules too, which is exactly why this guide has to draw the line sharply. In that article, mitigation is one rule among several for managing an order block. Here, the mitigation candle is the entire setup, and everything else, the entry, the stop, the invalidation, follows from that one candle.
| Feature | Order block | Mitigation block |
|---|---|---|
| What it is | The last opposing candle before a strong move | The last opposing candle before a break of structure |
| Zone width | Often a cluster of candles | One candle, high to low |
| Valid entries | On a return while the zone is fresh | On the first return only |
| After a touch | May still hold for another test | Spent: proven or dead, never traded again |
| Stop placement | Beyond the zone extreme | Beyond the candle extreme plus a buffer |
| Best session | London and New York | London and New York, never the dead hours |
| Biggest mistake | Trading a zone already tested twice | Trading the second return as if it were the first |
The practical consequence is simple. If I already traded the order block version of a zone, I do not also trade its mitigation block version, and if a zone has been touched once, I delete it from the chart. That deletion rule is what keeps this strategy from becoming the slow bleed that my old pullback trading was: a little loss on every return to a zone that had already given up its edge. On a funded account, where the daily loss limit is a hard wall rather than a suggestion, deleting spent zones is risk management disguised as chart hygiene.
How to mark a mitigation block, step by step
Marking takes less than a minute once the habit is set, and the habit is the whole game. First, find a break of structure on H1: a close through a swing high or low that had held at least twice before. Second, look at the candle immediately before the displacement run began, the last candle that moved against the direction of the break. Third, draw the rectangle from that candle’s high to its low, and extend it to the right. Fourth, check the displacement: the run after the break should cover at least twice the height of the mitigation candle, otherwise the move was not strong enough to leave anything unfilled. Fifth, wait. The trade does not exist until price returns to the rectangle, and most rectangles on most days never get a return, which is fine, because a setup that never triggers costs nothing, while a forced entry costs 500 dollars.
Two marking mistakes account for most of the losses I have seen traders take with this idea. The first is marking the wrong candle: traders pick the biggest candle in the run, or the candle with the longest wick, instead of the last candle before the break. The second is marking a block after a weak break, where price drifted through a level on thin volume and then drifted back, which produces a zone with no real unfilled orders behind it. My test for both mistakes is the same: if I cannot point to the break candle and the displacement candles in one breath, the block is not marked. Clarity is a filter, not a luxury, when the daily stop is only two trades deep.
The six rules I trade by
Rules are what turn a chart pattern into a funded-account strategy, because the pattern alone will tempt you into every return, every session, every wick. These six rules are non-negotiable for me, and breaking any one of them turns the trade into a different, untested strategy.
| Rule | The rule | Why it exists |
|---|---|---|
| 1 | First return only: if the zone has been touched since the break, delete it | A mitigated block has no edge left |
| 2 | Displacement must be at least twice the block height | Weak breaks leave no unfilled orders |
| 3 | Enter only on a rejection wick or a confirming close inside the zone | Blind limit orders get run over in trends |
| 4 | Stop beyond the block extreme plus a 5-pip buffer | Wicks hunt the exact extreme |
| 5 | Trade London (08:00-11:00) or New York (13:30-16:00) only | Dead hours produce fake returns |
| 6 | Never trade into a red-folder news release within 30 minutes either side | News breaks zones, stops and discipline alike |
Rule 3 deserves emphasis, because it is the one I broke most often when I started. A limit order sitting at the edge of the zone feels efficient, and it fills on every return, including the returns that slice straight through. Waiting for a rejection wick, a candle that enters the zone and closes back out of it, or a confirming close in my direction, costs me some trades that would have worked, and it saves me from the ones that run through the zone and keep going. On a funded account, the trades you skip are worth exactly as much as the trades you take, because the daily loss limit does not distinguish between a good idea badly timed and a bad idea.
The worked trade: entry, stop and targets on EURUSD
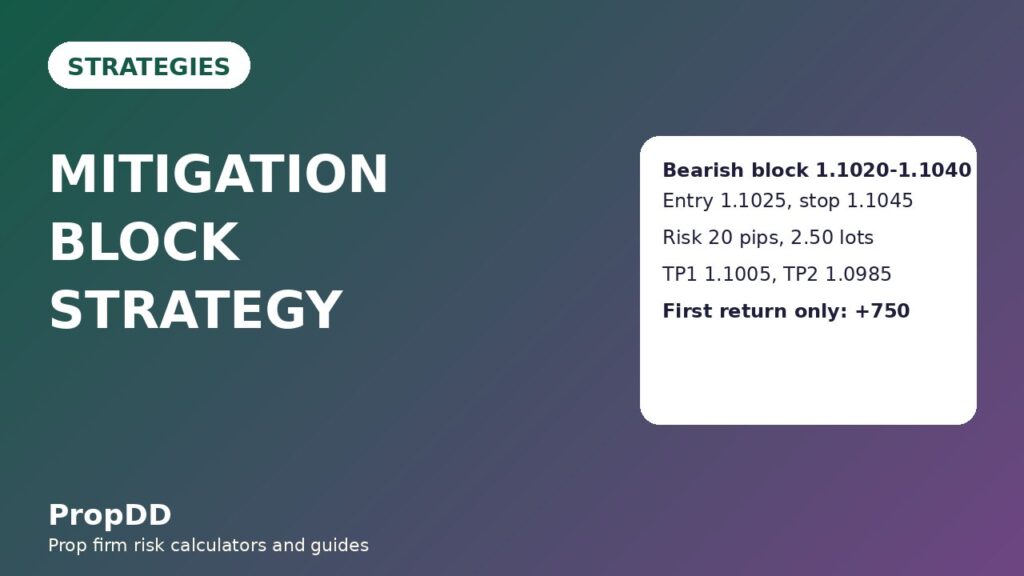
The trade that taught me this strategy properly happened on a Tuesday in the London session. EURUSD had broken down through the 1.1020 swing low after a weak bounce, and the last up candle before the displacement ran from 1.1020 to 1.1040, a 20-pip candle. The displacement that followed covered more than 60 pips in three hours, three times the block height, so the setup passed rule 2 comfortably. Price then pulled back into the block during the London morning, printed a rejection wick up to 1.1038, and closed back below the zone. I shorted at 1.1025, inside the block, with my stop above the block high plus the 5-pip buffer, at 1.1045. The risk was 20 pips, and at 2.50 lots that is exactly 500 dollars, my full per-trade risk, which the table below shows step by step.
| Trade element | Level | Maths |
|---|---|---|
| Mitigation block zone | 1.1020 to 1.1040 | Last up candle before the break, 20 pips tall |
| Displacement after the break | Over 60 pips in three hours | More than twice the block height, rule 2 passed |
| Confirmation | Rejection wick to 1.1038, close back below the zone | Rule 3 satisfied, entry triggered |
| Entry (short) | 1.1025 | Inside the block after confirmation |
| Stop loss | 1.1045 | Block high 1.1040 plus 5-pip buffer |
| Risk distance | 20 pips | 1.1045 minus 1.1025 |
| Position size | 2.50 lots | 500 divided by (20 pips x 10 dollars) |
| Risk in dollars | 500 dollars | 2.50 x 20 x 10, exactly my per-trade risk |
| First target (half off) | 1.1005 | 20 pips, 1R, bank 250 dollars |
| Second target (rest off) | 1.0985 | 40 pips, 2R, bank 500 dollars |
| Total if both targets hit | 750 dollars | 250 plus 500, which is 1.5R |
Price reached the first target within the same session, I took half off for 250 dollars, moved the stop to breakeven, and the rest ran to the second target for another 500 dollars. The total was 750 dollars on 500 dollars of risk, 1.5R, and the account closed the day up 750 dollars with one trade taken. That is the shape a funded-account day should have: one clean setup, one controlled risk, one partial taken early so the worst remaining outcome is breakeven, and then no more trading, because the daily plan was complete and the market owed me nothing further. The breakeven move matters more than it looks. Once half is banked and the stop is at entry, the trade can no longer hurt the daily loss limit, which is the only kind of free trade a funded account ever offers.
Position sizing under a daily loss limit
The sizing formula is the same one this series uses everywhere, and it is worth repeating here because mitigation blocks tempt traders into a specific sizing error: using the block height as the stop distance instead of the stop distance itself. The stop is the block extreme plus the buffer, and the buffer counts. A 20-pip block with a 5-pip buffer is a 25-pip stop if you enter at the far edge, and sizing off 20 pips instead of 25 over-risks the trade by a quarter. My formula, written out, is lots equal to risk divided by stop distance in pips times pip value, and the pip value on EURUSD is 10 dollars per lot per pip. I run the same inputs through the site’s max daily drawdown calculator before the session, so the sizing grid below is checked twice: once by hand, once by the tool.
| Stop distance (pips) | Lots (rounded down) | Risk in dollars | Why this row matters |
|---|---|---|---|
| 15 | 3.33 | 499.50 | Tight block, thin buffer: check the wick risk |
| 20 | 2.50 | 500.00 | The worked trade: exact 500-dollar risk |
| 25 | 2.00 | 500.00 | Block plus buffer from the far edge |
| 30 | 1.66 | 498.00 | Wider block in volatile London hours |
| 40 | 1.25 | 500.00 | News-adjacent volatility, still inside the rules |
| 50 | 1.00 | 500.00 | Maximum stop I accept for this setup |
Every row rounds lots down, never up, because rounding up is how a 500-dollar risk quietly becomes 510 or 520, and two such trades in one day eat the personal daily stop before the second trade even has a chance. If the calculated size falls below 0.50 lots, the setup is too wide for my risk budget and I skip it, because a trade that needs a 60-pip stop on a mitigation block is usually a block drawn on the wrong candle anyway. That skip rule is part of the strategy, not a failure of it: a setup that cannot be sized inside 500 dollars is a setup I cannot afford, and funded trading is mostly the discipline of not affording things.
When the strategy fails
Mitigation blocks fail in four recognisable ways, and naming them in advance is what stops me from improvising when they happen. The first is the second-return trap: price taps the block, rejects, and I miss the entry, then price comes back an hour later and I take it anyway, telling myself the zone is still valid. It is not, and the second return is where most mitigation losses come from. The second is the news spike: a red-folder release drives price through the block, through the stop, and the buffer means nothing, because news volatility does not respect candle ranges. Rule 6 exists for this, and I have no exception for it. The third is the weak break: the displacement was barely twice the block height, the zone was marginal, and price returns and grinds sideways through it instead of rejecting cleanly. The fourth is the trend day that never pulls back: I mark beautiful blocks all morning, price never returns, and I end the day flat, which feels like failure but is actually the strategy working, because a day with no valid return costs nothing and a forced entry would have cost 500 dollars.
The invalidation rule covers all four cases with one line: if price closes beyond the block extreme plus the buffer, the block is dead, the trade idea is dead, and I do not re-enter on a later return to the same rectangle. I delete the rectangle and move on. Traders who re-enter a dead block are usually trying to recover the loss from the first attempt, and recovery trading is the fastest route to the daily loss limit that exists. The funded account does not care that the zone looked good twice. It cares that you risked twice on an idea that had already failed once. For pullback trades that are not built on a break candle at all, the site’s trend pullback strategy guide covers a different, zone-based approach, and keeping the two setups separate is what stops one bad day from contaminating both.
The five-trade log and the filter test
A strategy is only as good as its recent log, so here is mine for this setup, five consecutive valid signals, no cherry-picking, including the one I skipped. The pattern that matters is not the win rate, it is that the skipped trade, the one where confirmation never came, cost nothing, while the taken trades paid for the losers with room to spare.
| Trade | Setup | Result | Running total |
|---|---|---|---|
| 1 | EURUSD bearish block, London, rejection wick | Win, plus 750 dollars (1.5R) | Plus 750 dollars |
| 2 | GBPUSD bullish block, New York, confirmation close | Loss, minus 500 dollars | Plus 250 dollars |
| 3 | EURUSD bearish block, London, rejection wick | Win, plus 750 dollars (1.5R) | Plus 1,000 dollars |
| 4 | USDJPY bearish block, Asian hours | Skipped: rule 5, wrong session, no trade taken | Plus 1,000 dollars |
| 5 | EURUSD bullish block, New York, confirmation close | Win, plus 750 dollars (1.5R) | Plus 1,750 dollars |
Five signals, four trades taken, three winners and one loser, plus 1,750 dollars, which is 3.5R. The more useful test is the filtered-versus-unfiltered comparison over a longer sample, because five trades prove nothing on their own. I backtested the same rules over a twelve-trade filtered sample and a fifteen-trade unfiltered sample, where unfiltered means taking every return including second returns, dead-hour returns and news-adjacent returns. The difference is the whole argument for the six rules.
| Sample | Trades | Wins / Losses | Net result | Best single day |
|---|---|---|---|---|
| Filtered (six rules applied) | 12 | 8 wins, 4 losses | Plus 4,000 dollars (8R) | 750 dollars, 18.8 percent of net, inside the 30 percent consistency ceiling |
| Unfiltered (every return taken) | 15 | 6 wins, 9 losses | Minus 1,500 dollars (minus 3R) | 500 dollars on a day the account still lost overall |
| Value of the filter | — | — | 5,500 dollars | The filter, not the pattern, is the edge |
The unfiltered sample lost money with the same pattern, the same pairs and the same targets, because second returns and dead-hour returns are not the same trade, they only look like it. That is why this guide spends more words on rules and invalidation than on the pattern itself. Anyone can draw the rectangle. The funded trader is the one who deletes it after one touch and walks away on days when it never triggers.
My daily routine for mitigation blocks
Routine is what makes the rules automatic, and automatic rules are the only ones that survive a losing morning. My session starts before London, not during it, because marking blocks in real time while price moves is how wrong candles get marked.
| Time (UK) | Task | Detail |
|---|---|---|
| 07:30 | Mark overnight breaks | Scan H1 for breaks of structure and mark fresh mitigation blocks only |
| 07:45 | Delete spent zones | Remove any block touched since it was marked, including overnight touches |
| 08:00 | Check the news calendar | Flag red-folder releases and their 30-minute exclusion windows |
| 08:00-11:00 | London window | Trade first returns only, maximum two trades, stop after two losses |
| 11:00-13:30 | Stand down | No trading: midday chop produces fake returns |
| 13:30-16:00 | New York window | Second window only if the daily stop is untouched |
| 16:00 | Close the book | Log every signal, taken or skipped, and delete all remaining blocks |
Deleting all remaining blocks at 16:00 is deliberate. A mitigation block is a one-session idea, not a level to carry into tomorrow, because overnight gaps and fresh breaks rewrite the structure it belonged to. Traders who keep yesterday’s rectangles on the chart end up trading yesterday’s market, and yesterday’s market has already paid out. If the same zone reforms tomorrow on a fresh break, I will mark it fresh, with fresh displacement behind it, and trade it as a new setup. That is the discipline in one sentence: every block gets one day, one return, and then it is gone.
Frequently asked questions
Is a mitigation block the same as an order block?
No, and confusing them is the costliest mistake with this idea. An order block is a broader zone that can be traded on a fresh return, while a mitigation block is one specific candle, the last candle before a break of structure, traded on its first return only. The site’s order block guide covers the broader idea; this strategy is the strict first-return version of it.
Can I trade a mitigation block a second time if the first return only wicked into it?
No. A touch is a touch, whether it wicked in by one pip or closed through the zone. The logic of the setup is that the first return fills the unfilled orders, and after that fill there is nothing left to trade. Delete the rectangle after any touch and wait for a fresh break to form a new block.
What timeframe works best for funded accounts?
H1, because it matches the two clocks a funded account runs on: the daily loss limit, which punishes overtrading, and the minimum trading days rule, which punishes doing nothing. Lower timeframes produce too many blocks and too many losses, while H4 produces too few signals to fill a challenge’s trading days.
How big should the displacement be?
At least twice the height of the mitigation candle, measured from the break to the extreme of the run. A smaller displacement means the move was not strong enough to leave meaningful unfilled orders, and the zone is more likely to be sliced through on the return. If the displacement is marginal, skip the setup.
Does this work on pairs other than EURUSD?
Yes, with the same rules, but size each pair on its own pip value and stop distance. The logic is structural, not pair-specific, and my log includes GBPUSD and EURUSD trades. Avoid applying it to pairs you have not sized before the session, because a wrong pip value turns a 500-dollar risk into something else entirely.
What if price never returns to the block?
Nothing happens, and that is a successful day for the strategy. A setup that never triggers costs nothing. Forcing an entry somewhere else because you are bored is how funded accounts get breached, and the daily routine above has a stand-down window built in precisely for that temptation.
Trading on a funded account involves risk, and past results, including the worked examples and logs in this guide, do not guarantee future results. Always trade within your firm’s rules and never risk more than your daily loss limit allows.



