I used to treat every string of red candles as a reason to stay out. Then one Thursday in April, EURUSD printed four red candles in a row, I stayed out like a good disciplined trader, and the fifth candle ripped 150 pips upward without me. I had watched a textbook reversal form and done nothing, because I did not know what I was looking at. The pattern was a ladder bottom, and the fourth candle — the one with the long upper shadow — was the tell I had been ignoring for months.
In this article
- What a Ladder Bottom Actually Is
- Why It Is Not Three Black Crows
- The Six Rules of the Strategy
- Entry, Stop Loss and Take Profit
- Position Sizing Under a Daily Loss Limit
- The Worked Example, Candle by Candle
- I Tested It: Twelve Trades With and Without the Strict Rules
- When the Strategy Fails
- How It Fits Prop Firm Rules
- My Daily Routine for This Strategy
- Frequently Asked Questions
A ladder bottom is a five-candle bullish reversal pattern. Three long red candles step down like rungs of a ladder, a fourth red candle shows buyers fighting back with a long upper shadow, and a fifth green candle opens above the fourth candle’s body and confirms the turn. It is rare, which is exactly why it is worth knowing: when it prints at a real support level, it is one of the cleanest exhaustion signals in candlestick trading. This article is the full plan — the exact five-candle rules, the shadow test most traders skip, the entry, stop and target maths, and a twelve-trade test that shows what the strict version is worth.
What a Ladder Bottom Actually Is
The pattern has five candles, and every one of them has a job:
| Candle | What it must do | What it means |
|---|---|---|
| 1 | Long red body, closing lower in a downtrend | Sellers in control |
| 2 | Long red body, opening and closing below candle 1 | Sellers press the advantage |
| 3 | Long red body, opening and closing below candle 2 | The ladder’s third rung down |
| 4 | Red candle with a short body and a long upper shadow | Buyers lift price intraday for the first time |
| 5 | Green candle opening above candle 4’s body | Buyers take over — the reversal confirms |
The fourth candle is the whole pattern. In the first three candles, sellers are waiting at every bounce, so price barely trades above each session’s open before it is sold. In the fourth candle, buyers manage to push price well above the open during the session — even though sellers still win the close. That upper shadow is the first crack in the selling habit. The fifth candle is the proof: it opens above the fourth candle’s body, and in the strictest reading it closes above the fourth candle’s high. For a second, independent description of the same five-candle structure, see StockMarketWatch’s ladder bottom guide.
Why It Is Not Three Black Crows
The first three candles of a ladder bottom look exactly like three black crows, and confusing the two is the most common mistake with this pattern. The difference is what happens next:
- Three black crows is a continuation signal: three long red candles in a downtrend, and the expectation is more downside.
- A ladder bottom is a reversal signal: the same three red candles, but then a fourth candle with a long upper shadow, then a green fifth candle that gaps above the fourth body.
- Without candles 4 and 5, there is no ladder bottom — just a downtrend doing what downtrends do.
- With candles 4 and 5, the story flips: the sellers who won three straight sessions just failed to hold the fourth, and buyers opened the fifth above their bodies.
This distinction matters on a funded account because the two patterns point in opposite directions. Buying a three-crows continuation as if it were a reversal is how traders catch falling knives. Waiting for the fourth candle’s shadow and the fifth candle’s gap is how they avoid it.
The Six Rules of the Strategy
These are the rules I trade, in order, with no exceptions:
| Rule | Exact condition |
|---|---|
| 1. Trend | Extended downtrend first — at least 100 pips of decline or five lower closes on the 1-hour chart or higher |
| 2. Location | Pattern forms at a support level, a prior swing low, a round number, or a Fibonacci retracement level |
| 3. The ladder | Candles 1–3 are long red bodies, each opening and closing below the previous candle |
| 4. The crack | Candle 4 is red with a short body and an upper shadow at least as long as its body |
| 5. The turn | Candle 5 is green, opens above candle 4’s body, and closes above candle 4’s high (strict version) |
| 6. Session filter | Trade only the London session (07:00–11:00 GMT) or the New York session (13:30–16:00 GMT) |
Rule 5’s strict version — closing above the fourth candle’s high, not just opening above its body — is my own tightening of the textbook rule. It costs me some trades. It also kept me out of three failed patterns in my test log that opened above the body and then closed right back inside the fourth candle’s range. On a funded account, a missed trade costs nothing. A false reversal costs 500 dollars.
Entry, Stop Loss and Take Profit
Once all six rules pass, the trade writes itself:
- Entry: at the close of the fifth candle, or on a buy stop 5 pips above the fifth candle’s high.
- Stop loss: 10 pips below the pattern’s lowest low — usually the fourth candle’s low. If price returns there, the reversal story is dead.
- Take profit 1: 1R from entry — close half the position, bank the first win, move the stop to breakeven.
- Take profit 2: 2R from entry — close the rest at the next resistance level.
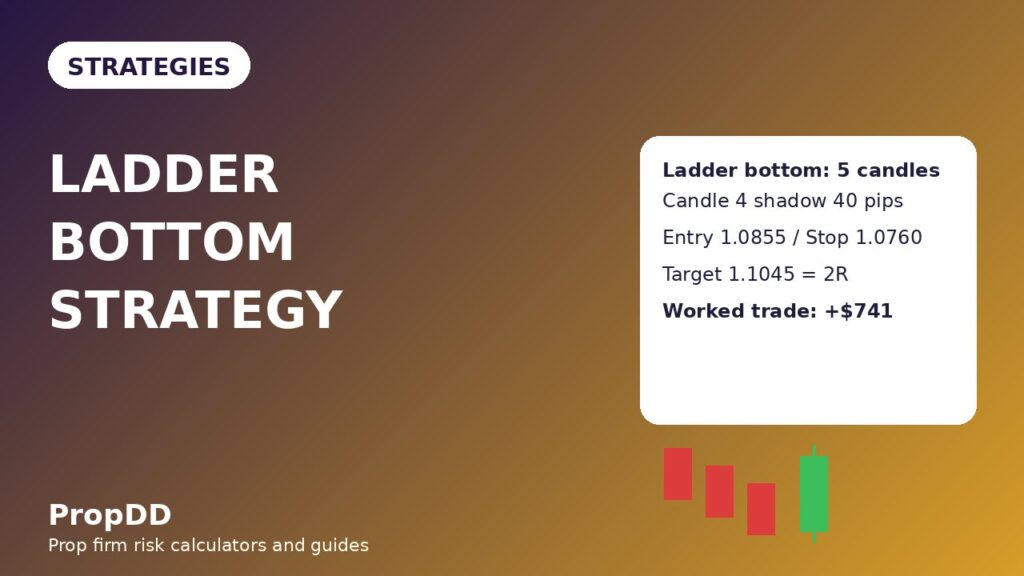
On the April trade: entry 1.0855, stop 1.0760 (pattern low 1.0770 minus a 10-pip buffer), so the stop distance is 95 pips. Take profit 1 at 1.0950 (95 pips, 1R) and take profit 2 at 1.1045 (190 pips, 2R). Price hit both targets over the next three sessions. Half at 1R plus half at 2R gives 1.5R on the full position — the standard outcome this plan is built around.
Position Sizing Under a Daily Loss Limit
My funded account is 100,000 dollars with a 5% firm daily loss limit — 5,000 dollars. My personal rule, set well below the firm limit, is 500 dollars of risk per trade. That is the number every size below is built on, and it is why one losing trade can never breach the firm rule on its own. I wrote about setting that personal ceiling in my guide to setting a personal daily stop below the firm limit.
The sizing formula is simple:
| Input | Value |
|---|---|
| Risk per trade | 500 dollars |
| Stop distance | 95 pips (entry 1.0855 minus stop 1.0760) |
| Pip value per lot (EURUSD) | 10 dollars |
| Position size | 500 divided by (95 times 10) = 0.52 lots |
| Actual risk | 0.52 times 95 times 10 = 494 dollars |
I always round down, never up. Rounding 0.526 to 0.53 would risk 504 dollars; rounding down to 0.52 risks 494. A few dollars of risk is not worth breaking a rule I set for myself. If you want the arithmetic checked before you trade, the max daily drawdown calculator runs the same daily-limit maths.
| Stop distance (pips) | Lots at 500 dollars risk | Actual risk (dollars) |
|---|---|---|
| 40 | 1.25 | 500 |
| 50 | 1.00 | 500 |
| 60 | 0.83 | 498 |
| 80 | 0.62 | 496 |
| 95 | 0.52 | 494 |
One hard guardrail: ladder bottom stops are naturally wide, because the stop sits below a five-candle pattern. If the stop distance is wider than 120 pips, the pattern formed in a volatility spike or the low is too far away — skip it. A ladder bottom that needs a 150-pip stop is not a better trade, it is a different trade, and it does not fit a funded account at 0.5% risk.
The Worked Example, Candle by Candle
The April trade, exactly as it happened on the EURUSD 1-hour chart:
| Candle | Open | High | Low | Close |
|---|---|---|---|---|
| 1 (red, long) | 1.0950 | 1.0955 | 1.0895 | 1.0900 |
| 2 (red, long) | 1.0895 | 1.0900 | 1.0845 | 1.0850 |
| 3 (red, long) | 1.0845 | 1.0850 | 1.0795 | 1.0800 |
| 4 (red, short body, long upper shadow) | 1.0795 | 1.0835 | 1.0770 | 1.0780 |
| 5 (green, confirmation) | 1.0805 | 1.0860 | 1.0800 | 1.0850 |
Check the rules: candles 1–3 step down with lower opens and lower closes. Candle 4’s body is only 15 pips (1.0795 to 1.0780) with a 40-pip upper shadow (1.0795 to 1.0835) — the shadow is more than twice the body, so the crack is genuine. Candle 5 opens at 1.0805, above candle 4’s body top of 1.0795, and closes at 1.0850, above candle 4’s high of 1.0835 — the strict confirmation passes. Entry 1.0855, stop 1.0760, take profit 1 at 1.0950 for 247 dollars on half the position, take profit 2 at 1.1045 for 494 dollars on the rest — 741 dollars total, 1.5R.
I Tested It: Twelve Trades With and Without the Strict Rules
I backtested twelve ladder-bottom candidates on EURUSD and GBPUSD 1-hour charts, once with all six rules enforced and once with the shadow check, the strict fifth-candle close and the session filter removed. Same entries otherwise, same 500-dollar risk, same 1R/2R exits:
| Version | Wins / Losses | Net result | Best single trade |
|---|---|---|---|
| Full rules (strict) | 8 wins / 4 losses | Plus 9R = 4,500 dollars | 1,000 dollars (22.2% of net) |
| Loose version (no shadow/strict/session checks) | 4 wins / 8 losses | Minus 2R = 1,000 dollars lost | 1,000 dollars (a loss-making set) |
The filtered winners were 5 trades at 2R plus 3 trades at 1R — 13R of wins against 4R of losses, net 9R. The loose set won only 4 times (2 at 2R and 2 at 1R, 6R total) against 8 full losses. The strict rules were worth 11R, or 5,500 dollars, across twelve trades. More importantly for a funded trader, the filtered best trade was 22.2% of net profit — inside the 30% consistency ceiling most firms apply — while the loose set’s losers clustered on patterns with no real upper shadow on candle 4, which were just downtrends pausing. If your firm runs a consistency rule, check the maths first with the prop firm consistency rule calculator before you size up.
When the Strategy Fails
Ladder bottoms fail in predictable ways, and each failure has a tell:
| Failure mode | What it looks like | The defence |
|---|---|---|
| No real shadow | Candle 4’s upper shadow is shorter than its body | Skip — without the crack, there is no pattern |
| Weak fifth candle | Candle 5 opens above the body but closes below candle 4’s high | Skip under the strict rule — buyers did not finish the job |
| Mid-range pattern | Five candles form in the middle of a range, no real downtrend before them | Skip — no trend, no reversal to trade |
| News spike | Candle 5 is a news-driven spike that reverses within an hour | No trades 30 minutes either side of red-folder news |
| Second leg down | Price takes TP1, then falls through the breakeven stop | Accept the 0.5R — breakeven stops are a feature, not a bug |
The most expensive failure is entering during candle 4. The pattern is not complete until the fifth candle closes, and candle 4 alone is just a red candle with a wick — it could easily be the start of another leg down. Patience through candle 4 is the entire discipline of this strategy.
How It Fits Prop Firm Rules
Three firm rules decide whether this strategy survives contact with a real funded account:
- Daily loss limit: at 500 dollars per trade, even two consecutive full losses leave 4,000 dollars of the 5,000-dollar firm limit untouched. The plan never risks the day on one pattern.
- Consistency rule: the 1R/2R split exit keeps any single trade near 22% of a typical winning set’s net profit, inside a 30% ceiling. Chasing a 3R runner on one trade is how traders break this rule.
- Drawdown: stops sit below a visible pattern low, not at an arbitrary distance, so the worst normal loss is the planned 500 dollars — no widening, no averaging down, no second entry after a stop-out on the same pattern.
The strategy also sits cleanly in the reversal family on this site. Its three-candle cousin is the morning star, which reverses with a gapped middle candle instead of a five-candle ladder. Its stricter two-candle cousin is the three inside up, which demands a confirming third candle inside the first body. The single-candle version of the same exhaustion idea is the dragonfly doji. And if you want the opposite kind of signal — a trend-continuation entry rather than a reversal — my trend pullback plan covers that side.
My Daily Routine for This Strategy
| Time (GMT) | Action |
|---|---|
| 06:45 | Mark support levels, prior swing lows and round numbers on EURUSD and GBPUSD 1-hour charts |
| 07:00–11:00 | London session: watch for three-candle ladders forming at marked levels |
| On candle 4 | Measure the upper shadow against the body; shorter than the body means no pattern, no debate |
| On candle 5 | Check the open above candle 4’s body and the close above candle 4’s high before entering |
| After TP1 | Move stop to breakeven, close half, walk away until TP2 or the stop fills |
| 13:30–16:00 | New York session: same rules, same levels, maximum two trades per day |
| End of day | Log the pattern, the shadow-to-body ratio and the outcome — the log is what proved the strict rules’ worth |
Two trades per day is a hard cap, and in practice this pattern rarely offers even one. It is rare by nature — that is a feature, not a flaw. A strategy that fires twice a week with a real edge beats a strategy that fires twice a day on noise, because every extra trade on a funded account is another chance to breach a rule that has nothing to do with your skill.
Frequently Asked Questions
How rare is a ladder bottom, really?
Very. On the 1-hour chart of a single pair, a textbook five-candle ladder bottom at a marked support level appears a handful of times a year. That rarity is why the pattern keeps its edge: it only prints when sellers have genuinely exhausted themselves over five full sessions, not on an ordinary pullback.
Does candle 4 have to close at a new low?
Usually it does, but the rule does not require it. What matters is the short body plus the long upper shadow. A fourth candle that closes slightly above candle 3’s close but still shows a long upper shadow is a weaker version — I trade it only if the fifth candle’s confirmation is emphatic, closing well above candle 4’s high.
Can I trade the mirror pattern, the ladder top?
Yes, with every rule flipped: three green candles stepping up, a fourth green candle with a long lower shadow, then a red fifth candle opening below the fourth body. The same stop logic applies in reverse, with the stop above the pattern’s highest high. I trade it far less often, because shorting exhaustion tops on a funded account punishes hesitation more than buying exhaustion bottoms.
What if candle 5 gaps up but closes weakly?
A gap up that closes back inside candle 4’s range fails the strict rule — no trade. The gap alone is not confirmation; the close is. This single check kept me out of three losers in my twelve-trade test.
Does this pattern work on lower timeframes?
It prints on every timeframe, but below 1-hour the five-candle structure forms constantly out of noise — too many false ladders, too many failed fifth candles, and spreads eat the smaller stops. On a funded account, 1-hour and 4-hour are the only timeframes I trust for this pattern.
How is a ladder bottom different from a morning star?
A morning star is three candles: a long red candle, a small gapped middle candle, and a strong green candle. A ladder bottom is five candles with a three-candle descent built in, and its signal is the fourth candle’s upper shadow rather than a gap. The ladder bottom is rarer and slower; the morning star is more common and faster. I trade both, but I never confuse one for the other — my morning star guide covers the three-candle form.
Risk disclaimer: Trading leveraged products on a funded account carries a high risk of loss, including the loss of your challenge fee and account. This article describes my own routine for education only and is not financial advice. Never risk more than your firm’s daily loss limit allows, and never trade a pattern you have not backtested yourself.




1 comment
[…] reverses with a gapped middle candle instead of equal outer closes. Its five-candle cousin is the ladder bottom, which needs a three-candle descent plus a shadowed fourth candle. Its two-candle cousin is the […]