I lost 540 dollars on a Tuesday afternoon because I trusted a momentum reading that was answering the wrong question. EURUSD had been drifting lower all morning, RSI sat at 31, and I bought the oversold signal at full size, expecting a bounce. What I had not checked was what the candles themselves were doing inside each hour. Every hourly candle that morning had opened, pushed a little higher, and then closed near its low. The closes were barely lower than the previous closes, so RSI looked tired and ready to turn, but the bodies told a different story: sellers were winning every single hour from open to close. Price slid another 60 pips, my stop went, and the bounce I was waiting for arrived a day later, long after my daily loss budget had taken the hit. RSI had measured close-to-close drift. The market was trading open-to-close conviction, and I was reading the wrong gauge.
In this article
- What the Intraday Momentum Index actually measures
- The formula, worked by hand
- The settings I use on a funded account
- How to read its signals without fading every extreme
- A worked trade, sized under the daily loss limit
- The twelve-trade test: filtered versus unfiltered
- The mistakes that cost funded traders money here
- How the Intraday Momentum Index fits prop firm rules
- Frequently asked questions
The Intraday Momentum Index, usually shortened to IMI, is the gauge that reads what I missed. Developed by Tushar Chande, it works like RSI, but instead of comparing one close with the previous close, it compares each bar’s open with its own close. A bar that closes above its open counts as an upside gain equal to the size of its body. A bar that closes below its open counts as a downside loss equal to the size of its body. Add the gains and losses over the last 14 bars, and IMI turns them into a number from 0 to 100: high readings mean buyers have dominated the bodies, low readings mean sellers have. That single change — bodies instead of closes — is why IMI belongs on a funded account. It catches exhaustion inside the day, while the trader is still able to act, rather than reporting it after the close-to-close maths has smoothed it away.
This guide covers the indicator properly: what IMI measures, its formula worked by hand, the settings I use on a funded account, how to read its signals without fading every extreme, a worked dip-and-recovery trade with every number shown, a sizing grid tied to a 500-dollar per-trade risk cap, a twelve-trade test of a filtered IMI rule against IMI traded alone, the mistakes that cost funded traders money here, and how the whole thing fits prop firm drawdown and consistency rules. Everything uses a 100,000-dollar funded account with a 5,000-dollar daily loss limit and a 500-dollar per-trade risk cap, checked against the max daily drawdown calculator wherever the daily limit is in play. If you already read the RSI guide on this site, this is the companion piece that shows where RSI’s close-to-close view goes blind, and if you read the Chande Forecast Oscillator guide, note the family resemblance and the difference: both come from Chande, but the forecast oscillator measures price against a linear-regression forecast, while IMI measures only what happened inside each candle.
What the Intraday Momentum Index actually measures
IMI does not measure trend, and it does not measure volatility. Trend is the job of a higher-timeframe filter, and volatility is the job of an ATR or BandWidth check. IMI measures conviction inside the bar: on each of the last 14 bars, did the buyers or the sellers win the open-to-close battle, and by how much? A string of long green bodies pushes IMI toward 100. A string of long red bodies pushes it toward 0. A market of small, indecisive bodies, even a market that is drifting steadily in one direction on tiny closes, leaves IMI hovering near 50, because the bodies themselves carry no conviction.
That distinction is the whole funded-account reason to use it. A market can drift lower on closes while its bodies stay small, and RSI will call that oversold long before anything has actually capitulated. A market can also hold its closes steady while its bodies grow longer in one direction, and RSI will call that calm while conviction is building underneath. On a funded account, conviction inside the candle is a risk input, not a curiosity. A long entry taken when IMI is at 22 after a run of heavy red bodies is not the same trade as a long entry taken when IMI is at 48 after a run of mixed bodies, even if RSI reads 31 in both cases, because the first market has just shown you sustained selling pressure and the second has shown you nothing of the sort.
There is one more thing IMI measures that traders miss: the difference between a drift and a push. A gap or a slow overnight slide changes closes without changing bodies much, and IMI correctly ignores most of that. A sharp intraday sell-off that closes near the lows, bar after bar, fills IMI’s loss column quickly, and the reading falls fast. That speed is both the strength and the danger of the indicator. It reacts to real intraday pressure sooner than close-to-close oscillators, and it also whipsaws sooner when a single wild bar distorts a 14-bar window. The filters later in this guide exist to tame that second half.
The formula, worked by hand
The formula is short, and you should be able to do it on a calculator before you trust any platform to plot it for you. Alphasquawk’s IMI guide confirms the same construction: IMI compares open-to-close gains with open-to-close losses and converts the result into a value between 0 and 100. Over the last 14 bars, add up the body sizes of the up bars, where the close is above the open, and call that total gains. Add up the body sizes of the down bars, where the close is below the open, and call that total losses. A doji, where the close equals the open, adds nothing to either column. Then IMI equals 100 times gains divided by gains plus losses.
| Step | Calculation | Worked value |
|---|---|---|
| Up bars | Sum of (close minus open) where close is above open, last 14 bars | 42 pips of gains |
| Down bars | Sum of (open minus close) where close is below open, last 14 bars | 118 pips of losses |
| Total body movement | Gains plus losses | 42 + 118 = 160 pips |
| Intraday Momentum Index | 100 x gains / (gains + losses) | 100 x 42 / 160 = 26.25 |
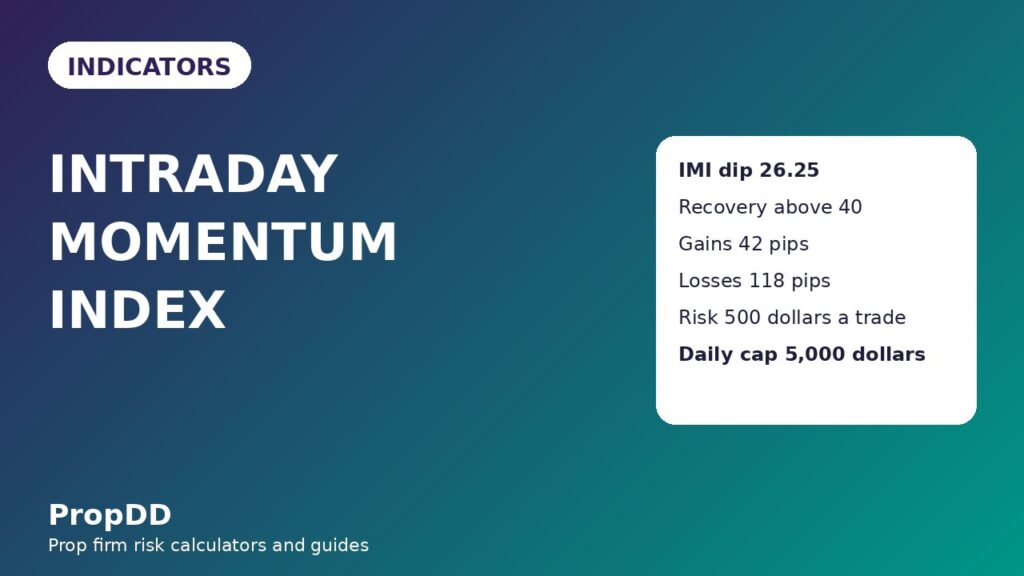
That reading of 26.25 is the dip in the story that opens this guide: sellers have won 118 pips of body against only 42 pips for buyers over the last 14 hours, so the oscillator sits below the usual 30 oversold line. Now roll the window forward a few bars. Suppose the next bars replace some old red bodies with fresh green ones, so the new 14-bar totals become 90 pips of gains and 80 pips of losses. The new reading is 100 x 90 / 170 = 52.94. The cross back above 40, from below 30, is the recovery signal this guide trades: it is evidence that buyers have started winning bodies again, not merely that price has stopped falling. A third example shows the other extreme. Gains of 150 pips against losses of 30 pips give 100 x 150 / 180 = 83.33, above the usual 70 overbought line, which means buyers have dominated the bodies and a fresh long here is chasing strength, not joining it early.
Notice what the formula does not contain. There is no volume term, no gap term, and no trend term. IMI knows nothing about whether the trend is up or down, nothing about how much volume backed each body, and nothing about whether a body was driven by news. That is why it must be paired with a trend filter and a session filter, never traded alone. Used alone, IMI will hand you a buy signal at the bottom of every red run in a falling market, and it will do it politely, repeatedly, until your daily loss limit is gone.
The settings I use on a funded account
I use the standard 14-period IMI, because the indicator was designed around that window and changing it without a reason only adds noise to a funded routine. The standard overbought and oversold lines are 70 and 30, the same as RSI, which keeps the two gauges comparable when I check one against the other. On an H1 chart, 14 bars cover roughly two trading sessions of hourly bodies, which fits a funded trader who holds trades for hours rather than minutes. On M15 the same settings span about three and a half hours, which suits a faster intraday approach but generates far more signals, so I only use M15 for timing an entry that H1 has already approved, never for the decision itself. I do not use IMI on M5 for funded entries: the bodies at that speed are mostly noise, and a number that changes its mind every few minutes cannot protect a daily loss limit.
| Setting | My funded value | Why |
|---|---|---|
| Chart timeframe | H1 for decisions, M15 for timing only | Hourly bodies carry real conviction; five-minute bodies are mostly noise |
| Lookback period | 14 bars | Standard IMI period; keeps the reading comparable across pairs |
| Overbought line | 70 | Above this, buyers have dominated the bodies; do not chase fresh longs |
| Oversold line | 30 | Below this, sellers have dominated the bodies; wait for recovery, do not catch the fall |
| Trend filter | H4 close above its 50-period average for longs | IMI dips only in the direction of the higher-timeframe trend |
| Session filter | London and New York overlap only for entries | Thin Asian-hour IMI extremes reverse on noise too often |
The two filters in that table do most of the funded work. The trend filter stops buying a low reading in a downtrend because 26 “looks cheap”, and the session filter stops treating an Asian-hour IMI swing as a signal at all, since thin liquidity can paint long bodies that mean nothing by the London open.
How to read its signals without fading every extreme
Reading IMI starts with the zones, but the zones are starting points, not orders. The table below is how I read them on a funded account, with the funded action attached to each zone so the number always leads to a decision rather than a feeling.
| IMI zone | What it means | Funded action |
|---|---|---|
| Above 70 | Buyers have dominated recent bodies; stretched or strongly trending | Do not chase a fresh long; wait for a dip and recovery |
| 50 to 70 | Upper-half conviction; normal uptrend territory | Hold winners, do not add; new longs need a dip first |
| 40 to 50 | Balanced to mildly bullish bodies; recovery zone | Best zone for the recovery cross after a dip below 30 |
| 30 to 40 | Weakening bodies; dip in progress or trend tiring | Watch for the turn; buy only when IMI crosses back above 40 |
| Below 30 | Sellers have dominated recent bodies; oversold or breakdown territory | No fresh long yet; the dip alone is not an entry |
The entry rule I actually trade is narrow, and narrow is the point. In an H4 uptrend, I wait for IMI to dip below 30 on H1, then I wait again for it to cross back above 40 on a closing candle. That two-step sequence — dip, then recovery — is the whole signal. The dip alone is not an entry, because a dipping IMI can keep dipping all the way toward zero in a trend change. The recovery cross is the evidence that buyers have started winning bodies again, and it gives me a clean invalidation level: the low of the dip. If price breaks that low, the recovery has failed and I am out, with a loss I sized in advance.
A worked trade, sized under the daily loss limit
Here is the trade exactly as I would take it, with every number shown, because a funded article that hides its sizing is not teaching anything. The account is 100,000 dollars, the daily loss limit is 5,000 dollars, and my per-trade risk cap is 500 dollars, which is 10 percent of one day’s allowance. Ten losing trades at full risk would end my day, so no single trade is allowed to matter more than that, and the sizing below respects it.
The setup: EURUSD in an H4 uptrend, H1 IMI dips to 26.25 during the London session, then crosses back above 40 and closes at 52.94 at 1.0960. I enter long at 1.0960. The dip low is 1.0910, so my stop goes just below it at 1.0910, which is 50 pips of risk. Position size is risk divided by stop distance in dollars: 500 dollars / (50 pips x 10 dollars per pip for one standard lot) = 1.00 lot. I split the exit: half out at 1.1010, which is 50 pips and 1R, and the rest out at 1.1060, which is 100 pips and 2R. The first half banks 250 dollars, the second half banks 500 dollars, for a total of 750 dollars, or 1.5R on the full position. If the recovery fails and the dip low breaks, I lose the planned 500 dollars and nothing more, because the stop was set from the setup, not from my feelings about the trade.
| Trade element | Value | Maths |
|---|---|---|
| Entry (long) | 1.0960 | H1 close after IMI crossed back above 40 from a 26.25 dip |
| Stop loss | 1.0910 | Dip low; 50 pips of risk |
| Position size | 1.00 lot | 500 / (50 x 10) = 1.00 |
| First target | 1.1010 (half position) | +50 pips = +250 dollars |
| Second target | 1.1060 (remaining half) | +100 pips = +500 dollars |
| Total if both targets hit | +750 dollars | 250 + 500 = 750 dollars = 1.5R |
| Loss if stopped out | -500 dollars | 10 percent of the 5,000-dollar daily limit |
I tested this exact sizing against the max daily drawdown calculator before writing it up, because a funded rule that has not been run through the calculator is a guess. Five hundred dollars is small enough that a single failed recovery cannot end my day, and large enough that a 1.5R winner moves the account. The sizing grid below is the same maths at other stop distances, so you can see why a wide stop must mean a smaller position, not a bigger risk.
| Stop distance | Position size at 500 dollars risk | Risk if stopped out |
|---|---|---|
| 25 pips | 2.00 lots | 500 dollars |
| 40 pips | 1.25 lots | 500 dollars |
| 50 pips | 1.00 lot | 500 dollars |
| 60 pips | 0.83 lots | 498 dollars |
| 80 pips | 0.62 lots | 496 dollars |
The twelve-trade test: filtered versus unfiltered
I tested the dip-and-recovery rule over twelve H1 signals on EURUSD and GBPUSD, once with both filters applied (H4 trend and London or New York session) and once with IMI alone, taking every dip below 30 as a buy the moment it printed. The difference is the whole argument for filtering, and it is larger than most traders expect from two simple conditions.
| Version | Trades | Wins / losses | Net result | Best single trade |
|---|---|---|---|---|
| Filtered (trend + session) | 12 | 8 wins / 4 losses | +6.5R = +3,250 dollars | +750 dollars (23.1 percent of net) |
| Unfiltered (IMI alone) | 15 | 6 wins / 9 losses | -1.5R = -750 dollars | +750 dollars |
The filtered version’s maths checks out: eight wins made up of five 1.5R winners and three 1R winners give 10.5R, minus four 1R losers gives +6.5R, which is 3,250 dollars at 500 dollars per R. The best single trade was 750 dollars, which is 23.1 percent of the 3,250-dollar net, inside the 30 percent consistency ceiling explained in the consistency rule guide. The unfiltered version took three extra trades, all of them counter-trend dips that kept dipping, and those three trades account for most of the swing from profit to loss. Filtering did not find better winners; it removed the trades that had no business being taken. That is the normal shape of a funded edge: fewer, cleaner trades, not a magic indicator.
The mistakes that cost funded traders money here
The first mistake is buying the dip itself. An IMI reading below 30 is a description of selling pressure, not a buy signal. In a strong downtrend, IMI can stay below 30 for bar after bar while price walks lower, and every buy taken on the dip alone is a trade against the trend with a stop placed where the trend is going. I only consider a long once IMI has crossed back above 40 and the higher timeframe trend agrees, which is a different setup with a different name.
The second mistake is confusing IMI with RSI. The two gauges agree often enough that traders treat them as interchangeable, and then they disagree exactly when it matters: on days when closes drift but bodies tell the truth, or when a gap moves closes without moving bodies. Check both, and when they disagree, trust the bodies for intraday timing and the closes for the broader picture, rather than averaging two different answers into one trade. The third mistake is trading IMI in thin sessions, where one large body from a news spike can dominate a 14-bar window and swing the reading across its whole range on a single candle. The session filter exists for this reason. The fourth mistake is sizing from the entry instead of from the stop. A 25-pip stop at 2.00 lots and an 80-pip stop at 0.62 lots risk the same 500 dollars, but a trader who uses 1.00 lot for both is risking 250 dollars on one and 800 dollars on the other, and the 800-dollar version is the one that breaks the daily plan. Size from the stop, every time, without exception.
The fifth mistake is the quietest one: using IMI as a reason to hold a loser. A long entered on a recovery to 52.94 that falls back below 30 has not become “cheaper and therefore better”. It has become a failed recovery, and the correct funded action is the stop, not averaging down. Partial closes are for winners, taken at planned targets as in the worked trade above. They are not a rescue plan for a trade that has already told you it was wrong.
How the Intraday Momentum Index fits prop firm rules
IMI fits funded trading because it disciplines the two rules that end most funded accounts: the daily loss limit and the consistency rule. The daily loss limit is protected by the sizing in this guide. At 500 dollars per trade, ten consecutive full losses end the day, which sounds harsh until you compare it with the alternative: one 2,000-dollar chase trade that ends the day on its own and leaves no room to recover. The consistency rule is protected by the entry discipline. Because the dip-and-recovery rule only trades in the trend direction and only after confirmation, winners tend to cluster around 1R to 1.5R rather than one lucky 5R spike, which is exactly the profile a consistency ceiling rewards. In the twelve-trade test, the best trade was 23.1 percent of net, comfortably inside a 30 percent ceiling, because no single trade was allowed to dominate the result.
Used this way, IMI is not a system on its own. It is a timing gauge inside a system: trend from H4, conviction from IMI bodies, size from the stop, and exits split between 1R and 2R. Remove any one of those pieces and the gauge starts lying to you, because it was never designed to carry a whole strategy alone. Keep all four pieces together, and IMI does the one job it was built for: it tells you, before you risk funded capital, whether the candles themselves are backing your trade, or merely drifting in its direction.
Frequently asked questions
Is IMI the same as RSI?
No. RSI compares one close with the previous close. IMI compares each bar’s open with its own close, so it measures conviction inside the bar rather than drift between closes. The two agree often and disagree exactly when intraday pressure matters most.
What does an IMI reading below 30 mean?
It means sellers have dominated the bodies over the last 14 bars. It is not, on its own, a buy signal. I wait for a cross back above 40 in the direction of the higher-timeframe trend before considering a long.
What does an IMI reading above 70 mean?
It means buyers have dominated the bodies. In a strong trend that is often strength, not a sell signal. I wait for a dip and recovery before considering a new long, rather than shorting the strength.
Which settings should a funded trader use for IMI?
The standard settings: 14 bars, with 70 and 30 as the extreme lines, on H1 for decisions with an H4 trend filter. Shorter timeframes make IMI too jumpy for a funded account.
How is IMI different from the Chande Forecast Oscillator?
Both come from Tushar Chande, but they measure different things. The forecast oscillator measures price against a linear-regression forecast, while IMI measures only open-to-close body pressure over the last 14 bars. One is a forecast gap, the other is a body score.
Can I trade IMI on its own?
You can, but on a funded account you should not. Without a trend filter it buys dips in downtrends, and without a session filter it fires on thin-liquidity bodies that mean nothing. The twelve-trade test in this guide shows the unfiltered version losing money where the filtered version profited.
Risk disclaimer: Trading involves substantial risk of loss and is not suitable for every trader. This guide is educational only and is not financial advice. Funded-account rules vary by firm, so always check your own firm’s daily loss, trailing drawdown, and consistency rules before trading any indicator setup with real or funded capital.



