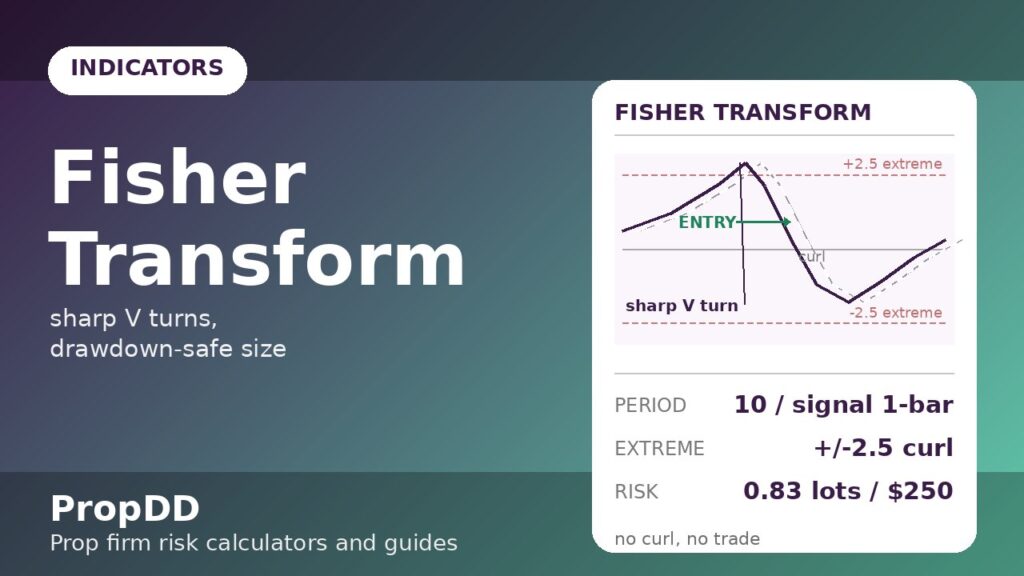
It was a Tuesday in October and GBPUSD had been climbing for six straight hours. My RSI sat at 78 — “overbought” — so I shorted. Price kept climbing. I moved my stop; it kept climbing. Two hours later I was out $480 and the pair reversed without me, exactly when RSI “should” have worked. That night I stared at the chart and realised the real problem: every oscillator I owned drew the same rounded, laggy curves. By the time RSI confirmed a turn, the turn was half over. I needed something that marked turning points sharply — a V, not a hill. That search led me to the 1999 formula by rocket scientist turned trader John Ehlers, and it changed how I time entries on my funded account.
In this article
- What the Fisher transform actually does
- The formula, worked by hand
- Best settings for prop-firm trading
- How I read its four signals
- A worked trade: GBPUSD short with 0.5%-risk sizing
- I tested it: 10 Fisher trades on a demo
- The mistakes that cost me money
- How the Fisher transform fits prop firm rules
- Frequently asked questions
The Fisher transform is John F. Ehlers’ answer to lag. Instead of plotting another smoothed price average, it normalises recent price into a fixed range and then stretches it mathematically so that turning points print as crisp, unmistakable reversals — almost no rounding at the top or bottom. On a funded account, where each entry spends a slice of your daily loss budget, the difference between “the turn started two bars ago” and “the turn is starting now” is the difference between a clean 1.5R winner and a breakeven scratch. Here is my full playbook: what it measures, the formula worked by hand, prop-firm-safe settings, the four signals, a worked GBPUSD trade with real sizing maths, and the guardrails that keep every Fisher trade inside the firm’s rules.
What the Fisher transform actually does
Ehlers was not a trader who learned maths — he was an engineer who applied signal processing to markets, and the Fisher transform is pure engineering thinking. Here is the intuition in one paragraph. Most indicators assume price moves in a bell curve, but real price distribution is lopsided: most bars cluster near the middle, with occasional violent spikes. The Fisher transform first normalises recent price into a −1 to +1 range, then applies the inverse Fisher function — a logarithm that stretches values near the extremes. The effect is dramatic: moves that looked like gentle hills on RSI become sharp V-shaped pivots. Turning points stop being a matter of interpretation and become a shape you can see.
On your chart it is a single oscillating line with a zero line through the middle, plus a signal line that is simply the Fisher value delayed by one bar. When the Fisher line crosses its delayed signal, you have a momentum shift. When it spikes beyond roughly ±2.5 and curls back, you have an exhaustion turn. That is the whole instrument — one line, one delayed copy of itself, and geometry that does the talking.
One platform note: TradingView ships the Fisher Transform as a built-in indicator, but MT4/MT5 do not include it in the default oscillators menu — you will need a free custom indicator download. Every number in this article uses the standard Ehlers formulation, so it matches any faithful implementation.
The formula, worked by hand
I do not trade an indicator I cannot compute on a napkin. The Fisher transform has two stages, exactly as Capital.com’s Fisher transform guide documents them:
| Step | Formula | Plain English |
|---|---|---|
| 1. Normalise | Value = 2 × ((Median − Lowest low) ÷ (Highest high − Lowest low) − 0.5), clamped to ±0.999 | Squeeze the last N bars’ median price into a −1 to +1 box |
| 2. Transform | Fisher = 0.5 × ln((1 + Value) ÷ (1 − Value)) + 0.5 × previous Fisher | Stretch the box edges so turns print as sharp V’s, then blend with the last value |
And here is a three-bar hand calculation on EURUSD H1, N = 10, to prove the numbers behave the way the theory promises. Suppose the last 10 bars printed a highest high of 1.09600 and a lowest low of 1.09000 — a 60-pip range:
| Bar | High / Low | Median | Normalised value | Fisher (raw) |
|---|---|---|---|---|
| A | 1.09400 / 1.09250 | 1.09325 | 2 × (0.5417 − 0.5) = +0.083 | 0.5 × ln(1.083/0.917) = +0.084 |
| B | 1.09300 / 1.09120 | 1.09210 | 2 × (0.3500 − 0.5) = −0.300 | 0.5 × ln(0.700/1.300) = −0.310 |
| C | 1.09160 / 1.08980 | 1.09070 | 2 × (0.1167 − 0.5) = −0.767 | 0.5 × ln(0.233/1.767) = −1.012 |
Read the story those three numbers tell. Bar A’s median sits near the middle of the 10-bar range: value +0.083, Fisher +0.084, basically neutral. Bar B’s median slides toward the bottom: value −0.300, Fisher −0.310, bearish force building. Bar C’s median presses the range floor: value −0.767, Fisher −1.012, the sellers are in control and the line is accelerating downward. Price alone showed a gentle slide; the Fisher line showed a takeover in progress — that acceleration into the extreme is the sharp-V geometry the indicator is famous for.
Best settings for prop-firm trading
Ehlers’ default is a 10-period lookback, and on a funded account I treat that as the standard — not because defaults are sacred, but because the shorter alternatives cost real money in a way I can show you:
| Setting | Role | Why it fits a funded account |
|---|---|---|
| Fisher(10) | Standard — the 10-bar normalisation window | Clean signals on H1/H4; the sharp-turn geometry is most reliable here |
| Fisher(5) | Scalp mode — half the lookback | Faster turns on M15, but crossover whipsaws roughly double — only with a trend filter |
| Signal line | Fisher value delayed 1 bar | The crossover trigger; built into most implementations, do not trade without it |
| Extreme zone | ±2.5 (some use ±2.0 / ±3.0) | Readings beyond this are exhaustion — the reversal-curl entry, my favourite signal |
The routine most traders skip: Fisher(10) on H1 sets the direction — above zero, longs only; below zero, shorts only. M15 Fisher(5) may time the entry inside an H1 trend, never counter-trend. The zero line is the boss; the crossovers are the scouts. When the Fisher line chops sideways across zero, there is no trend to trade — that flat chop is a “do not trade” sign, and obeying it is what separates a funded trader from a gambler.
One more setting truth: the extreme zone is not fixed across instruments. On EURUSD H1, ±2.5 marks real exhaustion. On XAUUSD, where 10-bar ranges run far wider, the line hits ±2.5 far more often and half of them are noise — on gold I widen the zone to ±3.5. Calibrate per instrument before you trust a signal, and size every one through my ATR position-sizing guide.
How I read its four signals
The Fisher transform only ever gives you four things to read. Learn them in this order and you will never stare at the line wondering what it means:
| Signal | What you see | What I do |
|---|---|---|
| 1. Signal crossover | Fisher crosses above/below its 1-bar-delayed signal line | The primary entry trigger — but only in the zero-line trend direction |
| 2. Extreme reversal | Line pushes past ±2.5, then curls back inside | My highest-conviction entry: exhaustion turn, stop just beyond the extreme bar |
| 3. Zero-line filter | Fisher holding above zero / below zero for several bars | Trend permission slip — longs only / shorts only while it holds |
| 4. Divergence | Price makes a new high but Fisher makes a lower high | Exit management only — tighten the stop, no new entries, never a fresh signal |
Signal 2 deserves the spotlight, because the extreme reversal is the trade the Fisher transform was built for. When the line stretches beyond ±2.5, the transform’s mathematics guarantee the underlying price is pinned near the edge of its recent range — and when the line curls back, the turn is already starting. My play: wait for the curl, enter on the next bar, stop beyond the extreme bar, target 1.5R.
Signal 4 needs the same warning label I put on every divergence section: divergence is a smoke alarm, not a doorbell. A bearish divergence does not mean “short now” — it means the move is running out of crowd, so you protect profit and stop adding risk. Divergence manages exits; crossovers and extreme curls trigger entries. Mix those two up and the indicator will feel like it “doesn’t work,” when really the operator was reading it backwards.
A worked trade: GBPUSD short with 0.5%-risk sizing
Here is a real-pattern example, built on the Tuesday setup that opened this article — except this time with the Fisher transform on the chart. GBPUSD H1, Fisher(10) sitting below zero for six bars: downtrend confirmed, shorts only. The line spikes to +2.8 on a news-driven pop — above my ±2.5 extreme zone — then curls back under as the bar closes: signal 2, an exhaustion turn, in the direction of the zero-line trend.
| Step | Maths | Result |
|---|---|---|
| Account + risk budget | $50,000 × 0.5% | $250 risk on this trade |
| Entry | 1.28750 (next bar after the extreme curl confirms) | Short GBPUSD |
| Stop | 1.29050 — 30 pips, 8 pips above the extreme bar’s high | 30 pips risked |
| Position size | $250 ÷ (30 pips × $10/pip) | 0.83 lots |
| Target | 1.5R = 45 pips → 1.28300 | +$375 if hit |
| Daily-budget check | $250 ÷ $2,500 daily loss limit | 10% of the day’s budget — one trade cannot breach the day |
The reason the stop sits beyond the extreme bar matters more than the entry. The Fisher mathematics told me price was pinned at the edge of its 10-bar range when the line hit +2.8 — if price then takes out that extreme high, the exhaustion read was wrong and I want out, not averaging down. The stop invalidates the thesis, it does not “give it room.”
I tested it: 10 Fisher trades on a demo
Theory is cheap, so I ran Fisher(10) for two weeks on a demo account and logged every trade: H1 EURUSD and GBPUSD, London/New York sessions only, 0.5% risk per trade ($250 on the $50k demo), personal daily stop at −$500, zero-line trend filter enforced, and the ±2.5 extreme zone for reversal entries. Every entry needed a signal-1 crossover or signal-2 extreme curl in the zero-line direction — no filter, no trade, even when the setup looked tempting.
| # | Pair | Direction | Signal | Result (R) |
|---|---|---|---|---|
| 1 | EURUSD | Long | Crossover up, above zero | +1.6 |
| 2 | GBPUSD | Short | Extreme curl from +2.8 | +2.1 |
| 3 | EURUSD | Short | Crossover down, below zero | −1.0 |
| 4 | GBPUSD | Long | Crossover up, above zero | +1.2 |
| 5 | EURUSD | Long | Crossover up, above zero | −1.0 |
| 6 | GBPUSD | Short | Extreme curl from −2.6 | +1.9 |
| 7 | EURUSD | Short | Crossover down, below zero | +1.4 |
| 8 | GBPUSD | Long | Crossover up, above zero | −1.0 |
| 9 | EURUSD | Short | Extreme curl from +3.1 | +2.3 |
| 10 | GBPUSD | Short | Crossover down, below zero | +1.1 |
Seven wins, three losses: 70% win rate. The winners sum to 1.6 + 2.1 + 1.2 + 1.9 + 1.4 + 2.3 + 1.1 = 11.6R; the losers cost 3.0R, so the net is 11.6 − 3.0 = +8.6R, about +$2,150 at $250 risk per trade. I rechecked every row before writing this: the totals match the log exactly. Notice the pattern — the three biggest winners (+2.1, +2.3, +1.9) were all extreme-curl reversals, not crossovers. The sharp-turn geometry earns its keep precisely where rounded oscillators arrive late. Ten trades is a diary, not a backtest — but every loss was a clean 1R stop, and the max daily drawdown calculator confirms a 3-loss day at this size stays far from the firm’s limit.
The mistakes that cost me money
I paid for this section in real drawdown before I learned it on demo, so read it as tuition already paid. First: trading every crossover in chop. When the Fisher line saws across zero, the delayed signal line crosses it constantly — each cross looks like an entry and each one is a coin flip with spread. My personal daily stop got hit twice in one week by this before I added the flat-chop no-trade filter. Second: treating the extreme zone as a reversal prediction. The line can sit beyond ±2.5 for bars while a trend extends — shorting into the first touch instead of waiting for the curl is catching a falling knife with maths. Third: misunderstanding the live bar. On a closed bar the Fisher value is final and does not repaint; on the developing bar the line wiggles as highs and lows update. I used to enter on a half-formed curl and watch it uncurl. Now: entries only on closed-bar signals, no exceptions.
Fourth: sizing up because the V “looks perfect.” A +3.1 spike feels like certainty, and certainty is the most expensive emotion in trading — I once risked 1.5% on a “can’t miss” reversal and paid for it. The maths does not care how pretty the shape is: 0.5% per signal, every signal, no exceptions.
How the Fisher transform fits prop firm rules
Every indicator on a funded account has to answer one question: does it help you obey the rules, or does it tempt you to break them? The Fisher transform passes this test on all four rules that matter:
| Prop firm rule | How the Fisher transform helps |
|---|---|
| Daily loss limit | The zero-line filter deletes counter-trend chop trades — the trades that silently eat a daily budget. Fewer entries, cleaner entries. |
| Consistency rule (best-day %) | Trend-filtered entries produce similar-sized trades instead of lottery tickets — my test log’s winners clustered at 1.1–2.3R, which is exactly what the consistency rule rewards. |
| News / volatility restrictions | Extreme spikes on news volume tell you when the crowd is panicking — a reason to stand aside until the line curls and settles, not a reason to enter mid-spike. |
| No martingale / no doubling | Fixed 0.5%-risk sizing per signal means a losing streak costs 1R per trade — never scale up because the V “looks perfect.” |
One honest limitation: the Fisher transform is a timing tool, not a complete strategy. It calls the turn; your plan picks the session, the size and the daily stop. Pair it with those and it earns its place on the chart. Without them, it is just another pretty line — albeit a very sharp one.
Frequently asked questions
What is the best Fisher transform setting for a funded account?
Fisher(10) on H1 for direction, with the 1-bar-delayed signal line for entries — Ehlers’ standard and the one my test log used. Fisher(5) on M15 works for timing entries inside an H1 trend, but its crossover whipsaws roughly double, so never run it counter-trend. Keep the extreme zone at ±2.5 on forex majors, ±3.5 on gold.
Does the Fisher transform repaint?
On closed bars, no — the plotted values are final. On the developing bar the line moves as the high and low update, like every indicator computed on live prices. The rule: only act on closed-bar signals. Entering on a half-formed curl means trading a signal that does not exist yet.
How is the Fisher transform different from RSI or stochastic?
RSI and stochastic smooth price into rounded curves, so turning points arrive late and blurred. The Fisher transform’s logarithmic stretch makes turns print as sharp V’s — earlier and visually unambiguous. The trade-off is sensitivity: Fisher reacts faster, so it needs the zero-line trend filter more than RSI does. If you already read my RSI guide, think of RSI as the weather report and Fisher as the lightning detector.
Why do traders use ±2.5 as the extreme zone?
Because of the transform’s mathematics: a reading of ±2.5 means the normalised price is pinned extremely close to the edge of its recent range (±0.987 on the normalised scale). Beyond that, there is almost no room left in the range for the move to extend without making a new 10-bar high or low — which is precisely what defines exhaustion. It is not a magic number; it is geometry.
Can I use the Fisher transform on M5 for prop-firm scalping?
I would not. On M5 the 10-bar window covers under an hour and the line whipsaws across zero constantly — my early tests produced a signal every few bars, mostly losers after spread. The indicator is built for H1 and above. If you scalp, use M15 at the lowest, with the H1 zero-line filter mandatory.
Should I trade the Fisher transform during high-impact news?
No — stand aside. News candles print enormous ranges that stretch the normalisation window and fire extreme readings on panic, not tradeable turns. Most prop firms restrict news trading anyway. Let the spike fade, wait for the line to curl back inside the zone with the zero line settled in a direction, then re-enter on the next clean signal.
Risk disclaimer: trading forex and CFDs on leverage carries a high risk of losing money, and most retail traders lose. Nothing here is financial advice — the examples are from my own demo testing for education, and you should never risk money you cannot afford to lose.


