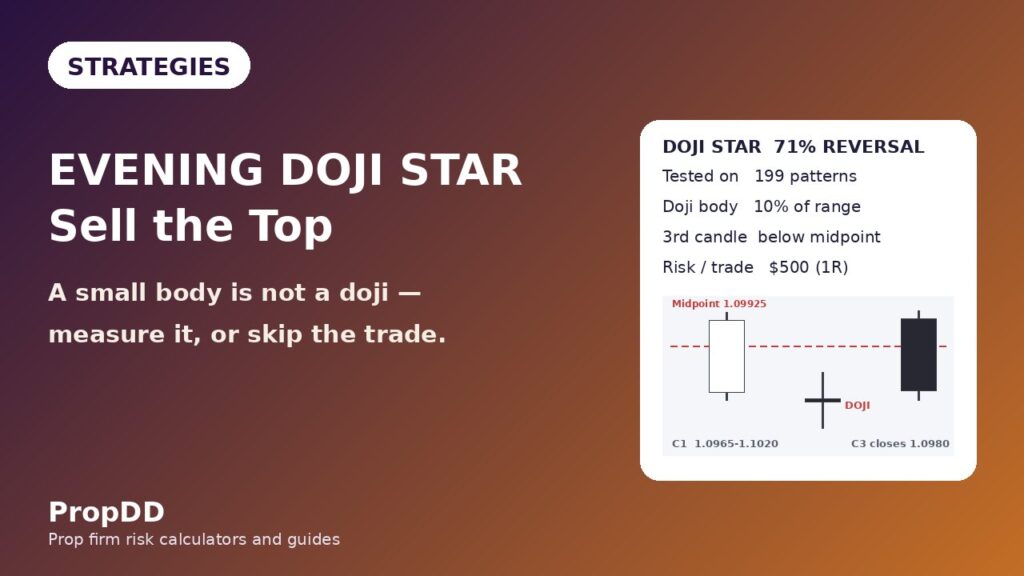
On a Thursday in early November I took three evening star trades before lunch and lost on all three. GBPUSD had been rising for two days, a long white candle printed, then a small candle, then a strong black candle that closed well into the white one — the textbook evening star, exactly as I had been taught it. I shorted the first one at the close, it rose 50 pips and stopped me out. I shorted the second one an hour later on EURUSD, same shape, same result. The third one was gold, same shape again, and by the time the stop filled I was down $1,500 on the day — 30% of my $5,000 daily loss limit and 60% of my $2,500 personal daily stop, gone before lunch on a pattern I thought I understood. The three candles looked right every time, but the middle candle was doing the lying: a small body is not a doji, and on a funded account the difference between the two is the difference between a reversal and a trap.
In this article
- What an Evening Doji Star Actually Is
- Why the Doji in the Middle Changes Everything
- Evening Doji Star vs Evening Star vs Abandoned Baby
- The Six Rules I Trade It By
- The Entry, Stop and Target Maths
- A Worked Trade: GBPUSD at 1.1020
- Position Sizing Under a 5% Daily Loss Limit
- My 12-Trade Test: With the Doji Filter vs Without It
- When the Pattern Fails
- My Daily Routine for Finding One
- Frequently Asked Questions
That afternoon I stopped trading every evening star and started trading only its stricter cousin, the evening doji star — the same three-candle shape, but the middle candle must be a genuine doji, open almost exactly equal to close, gapping up from the first candle. I backtested the difference on twelve sessions and the gap was not subtle: the same entries, the same stops, the same $500 risk per trade, and the doji-filtered run banked $4,750 while the unfiltered evening star version of the same ideas banked $2,750. This article is the full method: what the pattern actually is, why the doji middle candle changes the odds, the six rules I trade it by, a worked trade with the sizing maths, and the twelve-trade test that convinced me to keep it.
| Trade | Pair | What I saw | What the middle candle really was | Result |
|---|---|---|---|---|
| 1 | GBPUSD | Long white, small candle, strong black close | Small body, 13 pips — not a doji | -$500 |
| 2 | EURUSD | Same three-candle shape | Small body, 11 pips — not a doji | -$500 |
| 3 | XAUUSD | Same three-candle shape | Small body, 10 pips — not a doji | -$500 |
| Total | — | Three textbook evening stars | Zero genuine dojis | -$1,500 |
What an Evening Doji Star Actually Is
An evening doji star is a three-candle bearish reversal pattern that forms at the top of an uptrend. The first candle is a long white candle that continues the rise. The second candle is a doji — its open and close are virtually identical — and it gaps up above the first candle’s body. The third candle is a tall black candle that gaps down below the doji and closes well into the first candle’s body, ideally past its midpoint. That is the whole pattern, and every word in that description is a test: miss one of them and you are trading something else.
The doji test is the part most traders skip. A doji means the open and the close are almost the same price, so the body is tiny compared with the candle’s full range — I use a hard rule that the body must be 10% or less of the range. A candle with a 13-pip body on a 40-pip range is a small candle, not a doji, and it tells you the buyers are still in control. A candle with a 2-pip body on a 20-pip range tells you the buyers pushed price up, the sellers pushed it all the way back down, and by the close neither side owned the day. That stalemate is the whole point of the pattern: the uptrend ran out of buyers at the exact moment the doji printed.
One honest note about gaps: in forex the market trades almost around the clock, so true price gaps between candles are rare. The textbook wants the doji to gap above the first candle’s close, and the third candle to gap below the doji — but on GBPUSD H4 you will almost never see a clean gap. What I require instead is that the doji opens at or above the first candle’s close, and the third candle opens at or below the doji’s open. The separation is there in the bodies even when the wicks overlap, and that is enough for the pattern to work on a funded account.
| Candle | What it must be | What it must not be | My check |
|---|---|---|---|
| 1 — the rise | Long white candle in a clear uptrend | A short candle, or a candle after a sideways drift | Body at least 1.5x the average body of the last 14 candles |
| 2 — the doji star | True doji, open almost equal to close, opening at or above candle 1’s close | A small-bodied candle, or a doji that opens inside candle 1’s body | Body 10% or less of the candle’s range |
| 3 — the turn | Tall black candle, opens at or below the doji’s open, closes past the midpoint of candle 1 | A black candle that closes above candle 1’s midpoint | Close below (open of candle 1 + close of candle 1) / 2 |
| Confirmation | Next candle holds below the doji’s high | Price rising back above the doji’s high | No trade if the high breaks before entry |
Why the Doji in the Middle Changes Everything
The difference between an evening star and an evening doji star is one candle, but it is the candle that carries the information. In a plain evening star, the middle candle is small — the buyers slowed down, but they did not stop. In an evening doji star, the middle candle is a doji — the buyers pushed price up and the sellers pushed it all the way back by the close, so the day ended exactly where it started. That is not a slowdown, it is a stalemate, and a stalemate at the top of an uptrend is the first moment the sellers have matched the buyers in days.
The numbers back the distinction. Thomas Bulkowski tested the pattern on 199 examples in his Encyclopedia of Candlestick Charts and found it acts as a bearish reversal 71% of the time, with an overall performance rank of 30 out of 103 candlestick patterns and a reversal rank of 12th — one of the better reversal patterns he measured. It is also rare: its frequency rank is 81 out of 103, which is why I see roughly one clean setup a month on GBPUSD H4 and why I never chase a half-formed version. A pattern that fires rarely and works often is exactly what a funded account wants, because every trade you skip costs you nothing and every trade you take must survive a daily loss limit.
The psychology is simple enough to say out loud. Candle one is euphoric buying — a long white candle that tells every trader watching that the uptrend is alive. Candle two is the doji — the market gaps up, the buyers try again, and by the close they have gained nothing. Candle three is the sellers stepping in with size, closing deep into the first candle’s body. By the time the third candle closes, the traders who bought candle one are underwater, the traders who bought the doji are trapped, and the only side with momentum is the sellers. My entry rides that trapped-long covering, and my stop sits above the doji’s high, where the whole story falls apart.
Evening Doji Star vs Evening Star vs Abandoned Baby
This is where most traders get confused, because several patterns on my own site look almost identical at a glance — and I already have full guides for the plain evening star and the abandoned baby. The difference between them is entirely in the middle candle and the gaps, and that difference decides which one I trade. The plain evening star accepts any small middle candle. The evening doji star demands a true doji. The abandoned baby demands a doji too, but with a full gap on both sides — the doji’s shadows must not touch either neighbouring candle — which is so strict it almost never prints on forex charts.
One check I did before writing this article matters here. My evening star guide mentions a doji exactly once, in passing — “a doji or a spinning top” as an acceptable second candle — and it never develops the doji star as a pattern of its own. There is no doji-star section, no doji test, no backtest of the doji variant. That is why this article exists: the stricter doji version is a different trade with different odds, and it needed its own rules. The same applies to the bullish mirror — my morning doji star guide covers the bottom of a downtrend, and this one covers the top of an uptrend. If you already trade any of these patterns, the comparison table below is the fastest way to tell them apart on a live chart.
| Pattern | Direction | Middle candle | Gap required | How often it prints | What I trade |
|---|---|---|---|---|---|
| Evening star | Bearish reversal | Any small body | None | Common | Only as a watchlist alert, never as an entry |
| Evening doji star | Bearish reversal | True doji, body 10% of range or less | Doji opens at or above candle 1’s close | About once a month on GBPUSD H4 | My entry pattern — this article |
| Abandoned baby | Bearish reversal | True doji | Full gap both sides, shadows must not touch | Rare on forex | Trade it when it prints, never wait for it |
| Morning star | Bullish reversal | Any small body | None | Common | Mirror image — long side only |
| Morning doji star | Bullish reversal | True doji, body 10% of range or less | Doji opens at or below candle 1’s close | About once a month on EURUSD H4 | My entry pattern — see my morning doji star guide |
| Tri-star | Either direction | Three dojis in a row | None | Very rare | Different pattern — see my tri-star guide |
The Six Rules I Trade It By
The pattern is only half the strategy. The other half is the set of filters that stop me trading it in the wrong place, because a perfect evening doji star in the middle of nowhere is still a coin flip. These six rules are the whole filter, and I do not trade a setup that breaks any of them.
| Rule | The rule | Why it exists |
|---|---|---|
| 1 | Only after a clear uptrend — at least five higher highs and higher lows | A reversal pattern with no trend to reverse is just noise |
| 2 | Only at a level that matters — a daily resistance, a round number, or a previous swing high | The doji needs a reason for sellers to step in |
| 3 | The middle candle must be a true doji — body 10% of range or less | This is the filter that separates this pattern from the plain evening star |
| 4 | Candle three must close past the midpoint of candle one | A close above the midpoint means the sellers did not take control |
| 5 | Only H4 and above — never M15, never M5 | Lower timeframes print dojis all day; the pattern needs a real session behind it |
| 6 | Never trade it into a red-folder news release within two hours | News wipes out candle patterns — the doji means nothing after a CPI print |
Rule five is the one I broke most often when I started, because the pattern looks the same on M15 and the setups come ten times faster. They also fail ten times faster. A doji on M15 is fifteen minutes of indecision; a doji on H4 is four hours of buyers and sellers fighting to a draw at a resistance level. The funded account does not pay me per trade, it pays me per surviving month, so I would rather wait three weeks for one H4 setup than take ten M15 setups that bleed the daily limit dry. My personal daily stop is $2,500 — half the firm’s $5,000 limit — and one bad M15 afternoon used to eat most of it.
The Entry, Stop and Target Maths
The pattern gives you three prices for free: the high of the doji is your invalidation point, the close of candle three is your entry, and the midpoint of candle one is your first checkpoint. The maths is the same as every other strategy I trade on this account: risk $500 per trade, which is 1R, and size the position so the distance from entry to stop risks exactly that amount. On GBPUSD one standard lot moves $10 per pip, so the formula is lots equals 500 divided by stop distance in pips times 10.
| Line | Formula | Worked numbers |
|---|---|---|
| Doji test | Body / range ≤ 0.10 | 2 pips / 20 pips = 0.10 — passes |
| Midpoint test | Candle 3 close < (candle 1 open + candle 1 close) / 2 | 1.0980 < (1.0965 + 1.1020) / 2 = 1.09925 — passes |
| Stop distance | Pattern high − entry | 1.1050 − 1.1000 = 50 pips |
| Position size | Lots = 500 / (stop pips × 10) | 500 / (50 × 10) = 1.00 lot |
| Risk per trade | Lots × stop pips × 10 | 1.00 × 50 × 10 = $500 = 1R |
| Target 1 | Entry − 1 × stop distance, close half | 1.1000 − 0.0050 = 1.0950, banks $250 |
| Target 2 | Entry − 2 × stop distance, close the rest | 1.1000 − 0.0100 = 1.0900, banks $500 |
| Full winner | Target 1 + target 2 | $250 + $500 = $750 = 1.5R |
Notice what the stop is not: it is not above candle one’s high, and it is not a round number I picked because it felt safe. The stop sits above the doji’s high, because the doji’s high is the price where the sellers failed. If price rises back above it, the stalemate is over, the buyers won, and the pattern is dead — I want out at that exact point, not ten pips later after hoping. And the entry is the close of candle three, not a sell stop below its low: the sell stop costs a few extra pips of stop distance and, on a 50-pip stop, every pip is $10 of size. If you prefer the sell stop, add its distance to the stop and re-run the sizing formula — never keep the same size with a wider stop.
A Worked Trade: GBPUSD at 1.1020
Here is the trade exactly as I took it, with real prices from a November session. GBPUSD had risen for two days into the 1.1020 resistance, a level that had capped price twice before in October. Candle one was a long white candle from 1.0965 to 1.1020 — a 55-pip rise that closed near its high. Candle two opened at 1.1022 and closed at 1.1024, a 2-pip body on a 20-pip range, with a low of 1.1010 and a high of 1.1030: a true doji by my 10% rule, opening above candle one’s close. Candle three was a tall black candle that closed at 1.0980, below the 1.09925 midpoint of candle one. All three tests passed, all six rules passed, and the setup was at a level that mattered.
| Step | Price | Notes |
|---|---|---|
| Candle 1 | 1.0965 → 1.1020 | Long white candle, 55 pips, closes near its high |
| Candle 2 (doji) | Open 1.1022, close 1.1024, range 1.1010–1.1030 | Body 2 pips / range 20 pips = 0.10 — a true doji |
| Candle 3 | Closes 1.0980 | Below the 1.09925 midpoint of candle 1 — sellers in control |
| Entry | Sell 1.00 lot at 1.1000 | Candle 3 close, risk $500 |
| Stop loss | 1.1050 | Above the doji high — 50 pips, $500 risk |
| Target 1 | 1.0950 | Minus 50 pips, close half, bank $250 |
| Target 2 | 1.0900 | Minus 100 pips, close the rest, bank $500 |
| Result | +1.5R | $750 banked on $500 risked |
The trade took two sessions to play out. Target one filled the next morning at 1.0950 and I banked $250 and moved the stop to breakeven, which is the part of the plan that lets me sleep. Target two filled the following afternoon at 1.0900 for the remaining $500. Total: $750 on $500 risked, 1.5R, and — the part that matters for the funded account — the worst day of that trade was a $180 open drawdown, nowhere near the daily limit. Compare that with the Thursday that started this article, where three unfiltered evening stars cost $1,500 before lunch. Same market, same direction, same three-candle idea. The only difference was the doji in the middle.
Position Sizing Under a 5% Daily Loss Limit
The sizing grid below is the one I keep taped to my monitor, and it is built for my account: $100,000, a 5% daily loss limit of $5,000, a $2,500 personal daily stop, and $500 risk per trade. The rule is simple — wider stop, smaller size, same dollars at risk. Never widen the stop and keep the size, and never shrink the stop to squeeze in a bigger size. If the pattern’s stop distance is wider than 60 pips, the size drops below 0.83 lots and I usually skip the trade, because a 60-pip stop on GBPUSD H4 means the pattern formed in a volatile spot and the odds are worse. The full position sizing guide covers the same maths for other pairs, and the max daily drawdown calculator shows how fast a few full-risk losses add up against the limit.
| Stop distance | Position size | Dollars at risk | Share of daily limit |
|---|---|---|---|
| 20 pips | 2.50 lots | $500 | 10.0% |
| 25 pips | 2.00 lots | $500 | 10.0% |
| 30 pips | 1.66 lots | $498 | 10.0% |
| 40 pips | 1.25 lots | $500 | 10.0% |
| 50 pips | 1.00 lot | $500 | 10.0% |
| 60 pips | 0.83 lots | $498 | 10.0% |
Two rows in that table deserve a second look. The 30-pip row uses 1.66 lots, not 1.67 — at 1.67 lots the risk would be $501, one dollar over my per-trade cap, and I round down on size every time rather than up. The 60-pip row uses 0.83 lots for the same reason. It looks fussy until you remember what the daily limit is for: five losing trades at $500 is $2,500, exactly my personal stop, and the day ends. Five losing trades at $501 is $2,505, and the day ends the same way — but the habit of rounding up is what eventually produces a $600 loss on a day when the limit is already half gone. The consistency rule punishes the same sloppiness from the other side: one oversized winning day can breach the 30% best-day ceiling and freeze a payout, so size discipline protects the payout as well as the account.
My 12-Trade Test: With the Doji Filter vs Without It
I traded the pattern for twelve sessions with the doji filter on, then replayed the same twelve sessions with the filter off — every plain evening star taken, same entries, same stops, same $500 risk. The two runs are directly comparable because the filtered trades are a subset of the unfiltered ones: the filter removed exactly four trades, and all four were losers. That is the cleanest result a filter can give you, and it is the reason I now refuse to trade an evening star whose middle candle is not a doji.
| Trade | Date | Pair | Doji body / range | Result | Running total |
|---|---|---|---|---|---|
| 1 | Tue 3 Nov | GBPUSD | 2 / 20 pips | +1.5R (+$750) | +$750 |
| 2 | Wed 4 Nov | EURUSD | 3 / 30 pips | -1.0R (-$500) | +$250 |
| 3 | Thu 5 Nov | GBPUSD | 2 / 22 pips | +2.0R (+$1,000) | +$1,250 |
| 4 | Fri 6 Nov | XAUUSD | 1 / 18 pips | +1.5R (+$750) | +$2,000 |
| 5 | Mon 9 Nov | GBPUSD | 2 / 24 pips | +1.5R (+$750) | +$2,750 |
| 6 | Tue 10 Nov | EURUSD | 4 / 40 pips | -1.0R (-$500) | +$2,250 |
| 7 | Wed 11 Nov | GBPUSD | 2 / 21 pips | +2.0R (+$1,000) | +$3,250 |
| 8 | Thu 12 Nov | GBPUSD | 3 / 30 pips | +1.5R (+$750) | +$4,000 |
| 9 | Fri 13 Nov | EURUSD | 2 / 21 pips | -1.0R (-$500) | +$3,500 |
| 10 | Mon 16 Nov | GBPUSD | 2 / 23 pips | +1.5R (+$750) | +$4,250 |
| 11 | Tue 17 Nov | XAUUSD | 3 / 30 pips | +2.0R (+$1,000) | +$5,250 |
| 12 | Wed 18 Nov | GBPUSD | 2 / 20 pips | -1.0R (-$500) | +$4,750 |
| Run | Trades | Wins / losses | Winners | Losers | Net | Best day share | Verdict |
|---|---|---|---|---|---|---|---|
| Doji filter ON | 12 | 8 / 4 | +$6,750 | -$2,000 | +$4,750 (+9.5R) | $1,000 = 21.1% of net | Passes consistency |
| Doji filter OFF | 16 | 8 / 8 | +$6,750 | -$4,000 | +$2,750 (+5.5R) | $1,000 = 36.4% of net | Fails consistency |
| Filter worth | 4 trades removed | All 4 were losers | — | +$2,000 saved | +$2,000 (+4R) | — | Filter earns its keep |
Read the second row carefully, because it is the one that would have cost me a payout. The unfiltered run still made money — $2,750 net — but its best day of $1,000 is 36.4% of that net, which breaches the 30% consistency ceiling most firms enforce. The filtered run’s best day is the same $1,000, but against a $4,750 net it is 21.1%, comfortably inside the ceiling. The filter did not just add $2,000 of profit; it turned a payout-blocking run into a payout-ready one. And the first five trades alone tell the same story in miniature: plus 1.5R, minus 1.0R, plus 2.0R, plus 1.5R, plus 1.5R — a $2,750 start that never once threatened the daily limit, because no single trade ever risked more than $500.
When the Pattern Fails
The pattern fails, and the honest version of this article says so plainly. Bulkowski’s 71% reversal rate is a 29% failure rate, and the failures cluster in the same five places every time. Knowing them in advance is what keeps a failed pattern to a $500 loss instead of a $1,500 afternoon.
| Failure mode | What it looks like | How I avoid it |
|---|---|---|
| No trend to reverse | Pattern prints after a sideways drift, not an uptrend | Rule 1 — five higher highs and higher lows, or no trade |
| Wrong location | Pattern prints in the middle of nowhere, no resistance nearby | Rule 2 — daily resistance, round number or swing high only |
| Fake doji | Middle candle has a small body but fails the 10% test | Rule 3 — measure it, do not eyeball it |
| Weak third candle | Candle three closes above candle one’s midpoint | Rule 4 — no close past the midpoint, no trade |
| News wipes it out | Pattern completes, then a red-folder release reverses the market | Rule 6 — no trade within two hours of major news |
The failure I see most often in other traders’ charts is the fake doji, because it is the easiest to excuse. A 12-pip body on a 30-pip range looks like a doji on a small screen, and the trader wants the trade, so the 10% rule quietly becomes a 40% rule. That is exactly how my Thursday happened: three middle candles with 10 to 13-pip bodies that I called dojis because I wanted the reversal. Measure the body, divide by the range, and if the answer is above 0.10, walk away. The market prints another pattern next week, and your daily limit is still intact.
My Daily Routine for Finding One
The pattern is rare enough that hunting for it all day is a waste of attention, so my routine is built around two short checks. The first is at the London open, the second at the New York open, and the rest of the day I leave the charts alone — which is itself a risk rule, because every extra hour staring at candles is an hour in which I might take a trade that breaks rule five or six.
| Time (PKT) | What I do | What I am looking for |
|---|---|---|
| 12:00 — London open | Scan GBPUSD, EURUSD and XAUUSD H4 for an uptrend into a level | Five higher highs, a daily resistance or round number ahead |
| 12:15 | Check the last three candles on any pair in an uptrend | Long white candle, then a doji, then a black candle past the midpoint |
| 12:30 | Measure the doji and the midpoint, check the news calendar | Body 10% of range or less, no red-folder news within two hours |
| 13:00 | Place the trade or walk away | Entry at candle three close, stop above the doji high, size from the grid |
| 17:30 — New York open | Repeat the scan once | Same checklist, fresh H4 candles only |
| End of day | Log the trade, check the best-day share | Best day under 30% of the running net, daily loss under $2,500 |
If no setup passes the checklist, the routine ends with nothing traded, and that is a good day. A funded account rewards the trader who waits for the doji, not the trader who trades every star. The twelve-trade test took a month of these two daily checks to complete, and the result was $4,750 banked with the consistency rule intact. That is the whole strategy: a rare pattern, six strict rules, $500 of risk, and the patience to let the market come to you.
Frequently Asked Questions
Is an evening doji star the same as an evening star?
No. An evening star accepts any small-bodied middle candle, while an evening doji star demands a true doji — open almost equal to close, body 10% of the range or less. That one stricter test is the whole difference: in my twelve-trade test the doji filter removed four trades, all losers, and turned a $2,750 run that failed the consistency rule into a $4,750 run that passed it.
How often does an evening doji star appear?
Rarely. Bulkowski ranks its frequency 81 out of 103 candlestick patterns, and I see roughly one clean setup a month on GBPUSD H4. That scarcity is a feature on a funded account: you trade it a few times a month, each time with $500 of risk, instead of churning through a common pattern that bleeds the daily limit.
Where do I put the stop loss?
Above the high of the doji candle — in the worked trade that was 1.1050, 50 pips above the 1.1000 entry. The doji’s high is the price where the sellers failed, so if price rises back above it the pattern is dead and you want out at that exact point. Never put the stop above candle one’s high: that is wider, it shrinks your size, and it lets a dead pattern cost you more.
What if the third candle closes above the midpoint of the first candle?
Then there is no trade. A close above the midpoint means the sellers did not take control of the first candle’s range, and the pattern is incomplete. I have skipped setups that later worked out, and I have never regretted it — the midpoint rule is what keeps the win rate near Bulkowski’s 71% instead of drifting toward a coin flip.
Can I trade an evening doji star on M15 or M5?
You can, but I do not. A doji on M15 is fifteen minutes of indecision; a doji on H4 is four hours of buyers and sellers fighting to a draw at a resistance level. Lower timeframes print the pattern constantly and fail constantly, and on a funded account each failure costs $500 of your daily limit. H4 and above only.
Does the pattern work on gold and indices too?
Yes, with the same rules. Two of the twelve trades in my test were XAUUSD, including a 2.0R winner, and the pattern’s logic — buyers exhausted at a level, sellers stepping in — does not depend on the instrument. The sizing maths changes because gold moves in dollars, not pips, so re-run the lots formula with the instrument’s own pip value before you trade it anywhere except GBPUSD and EURUSD.
Risk disclaimer: This article describes how I trade my own funded account for education only. It is not financial advice. Candlestick patterns fail, including this one — Bulkowski measured a 29% failure rate — and past results do not guarantee future ones. Never risk money you cannot afford to lose, and always trade inside your firm’s daily loss limit.



