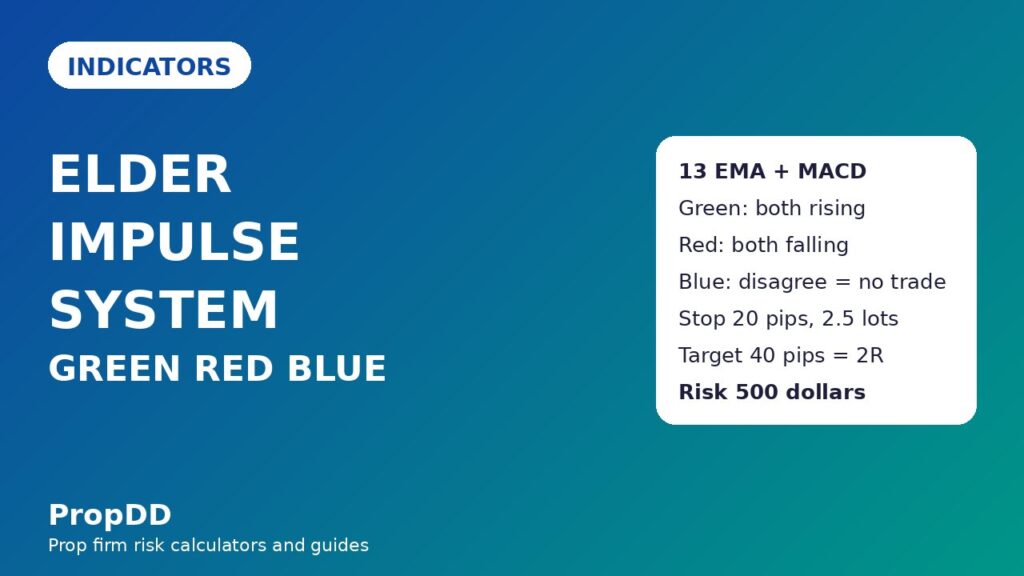
I blew a funded morning on a single blue bar. The chart looked bullish, the MACD histogram was climbing, and I bought EURUSD into what felt like momentum — except the 13-period EMA was still falling, which meant the trend underneath me was down. Price stalled, reversed, and took my stop, then took a second trade’s stop when I tried again, still arguing with the same blue bar. That was the day I stopped reading the Elder Impulse System as a buy-and-sell signal and started reading it as a permission slip. Green means both engines agree upward, red means both agree downward, and blue means they disagree — and on a funded account, disagreement is not a maybe, it is a no. Everything in this guide uses a 100,000-dollar funded account with a 5,000-dollar daily loss limit and a 500-dollar per-trade risk cap.
In this article
- What the Elder Impulse System actually measures
- The formula, in plain numbers
- How to read the three colours
- Best settings for prop-firm trading
- A worked example with real numbers
- I tested it: ten filtered trades against ten unfiltered ones
- Common mistakes, and how the system fits prop-firm rules
- My daily routine with the Impulse System
- Frequently asked questions
The Elder Impulse System was developed by Alexander Elder and set out in his book Come Into My Trading Room. It is not a new oscillator and it is not a secret indicator: it is two familiar tools bolted together so that each one checks the other. The 13-period exponential moving average measures the trend, and the MACD histogram measures momentum. When both point the same way, the bar is coloured green or red. When they point in opposite directions, the bar is blue. That colour is the whole system, and on a funded account it solves the exact problem that kills most traders: entering a momentum trade against the trend, or a trend trade with dying momentum, and then paying for the contradiction with daily-limit room.
What the Elder Impulse System actually measures
Most indicators answer one question. A moving average answers “which way is price leaning?” An oscillator answers “is the move speeding up or slowing down?” The Impulse System answers both at once, and refuses to answer when the two answers conflict. That refusal is its value. A green bar says the short-term trend is rising and momentum is rising with it. A red bar says the trend is falling and momentum is falling with it. A blue bar says one of those statements is false, and the honest response is to wait. Funded traders do not need more signals; they need fewer, better ones, because every losing trade costs daily-limit room that cannot be bought back. The system is therefore best used as a filter on trades you already like, not as a machine that manufactures entries. If your setup says buy but the bar is blue or red, the setup waits. If your setup says buy and the bar is green, the setup has two independent witnesses instead of one.
It is worth separating this system from its cousin on this site, Elder Ray. Elder Ray measures Bull Power and Bear Power against the same 13-period EMA — how far the high sits above the average, and how far the low sits below it. The Impulse System does something different: it compares the slope of the 13-period EMA with the slope of the MACD histogram and turns the result into a bar colour. Same author, same average, different calculation and different question. If you already trade Elder Ray, think of the Impulse System as the traffic light on top of it: Elder Ray tells you who is strong, the Impulse System tells you whether trend and momentum agree that strength is usable.
The formula, in plain numbers
There are three pieces, and none of them is exotic. The EMA smooths price with a weighting that favours recent bars. The MACD subtracts a slow EMA from a fast one. The histogram subtracts the MACD’s own signal line from the MACD, so it shows whether MACD momentum is rising or falling. The colour rule then needs only two slopes: is the 13-period EMA higher than it was on the previous bar, and is the histogram higher than it was on the previous bar? A clear walkthrough of the same construction is given in the Elder Impulse System explained guide.
| Piece | Formula | What it tells you |
|---|---|---|
| EMA smoothing factor | k = 2 / (13 + 1) = 0.1429 | Each new close carries about 14 percent of the EMA’s weight |
| 13-period EMA | EMA today = (Close x 0.1429) + (EMA yesterday x 0.8571) | The trend line: rising means uptrend, falling means downtrend |
| MACD line | MACD = EMA 12 – EMA 26 | Fast momentum minus slow momentum |
| Signal line | Signal = 9-period EMA of the MACD line | The smoothed MACD, used only to build the histogram |
| MACD histogram | Histogram = MACD – Signal | Positive and rising means momentum is strengthening |
| Impulse colour | Green if EMA rising AND histogram rising; red if both falling; blue otherwise | Agreement, or the lack of it |
Notice what the formula does not do: it never asks whether the histogram is above or below zero, only whether it is rising or falling. A histogram can be below zero and still rising, which gives a green bar in a downtrend’s early recovery — a nuance that matters, because the first green bars of a turn are often the ones funded traders dismiss as “still negative” and miss. Equally, a histogram above zero but falling gives a red bar while price still looks strong, which is exactly the warning that saved me from adding to a dying long more than once. The system reads direction of travel, not altitude.
How to read the three colours
| Bar colour | EMA 13 slope | Histogram slope | What it means | Funded-account action |
|---|---|---|---|---|
| Green | Rising | Rising | Trend up, momentum up | Longs allowed; shorts forbidden |
| Red | Falling | Falling | Trend down, momentum down | Shorts allowed; longs forbidden |
| Blue | Rising, histogram falling | Disagreement | Trend and momentum conflict | No new trade in either direction |
| Blue | Falling, histogram rising | Disagreement | Recovery may be starting, or a bounce failing | No new trade; watch for the next green or red bar |
Elder’s own discipline, which I now treat as a rule rather than advice, is to enter cautiously and exit fast. The system is built for relatively short moves, not for riding a trend for weeks. On a funded account that fits perfectly: the daily loss limit punishes traders who sit through reversals hoping a trade comes back, and rewards traders who take a clean impulse, bank part of it, and step aside.
Best settings for prop-firm trading
The defaults are the settings, and changing them is the first mistake. Elder’s system uses a 13-period EMA and the standard MACD at 12, 26 and 9. Traders who “optimise” it to a 10-period EMA or a faster MACD on a five-minute chart get more colours, more trades, and more daily-limit damage. The funded-account version keeps the defaults and changes the timeframe and the filter instead: H1 for entries, H4 for direction, and no trade when the two timeframes disagree. That single rule cut my blue-bar losses more than any setting tweak ever did.
| Setting | Funded-account value | Why |
|---|---|---|
| EMA period | 13 | Elder’s original; short enough to turn, long enough to ignore noise |
| MACD | 12, 26, 9 | Standard; the histogram slope is the signal, not the MACD cross |
| Entry timeframe | H1 | Enough bars for the colour to mean something, few enough trades to stay inside the daily limit |
| Direction timeframe | H4 | H1 green inside H4 red is a counter-trend trade, and funded accounts punish those first |
| Session filter | London and New York overlap only | Thin Asian-session bars flip colour on almost no volume |
| Daily trade cap | 3 impulse trades per day | Three losses at 500 dollars is 1,500 dollars, still well inside a 5,000-dollar limit |
One practical note: most platforms do not ship an Impulse System indicator, and the ones that do sometimes colour bars by the histogram’s position above or below zero rather than its slope. Check yours on a known sequence before trusting it. If a bar is green while the histogram is falling, your indicator is wrong by Elder’s definition, and every rule in this guide will misfire. The manual check takes two minutes: find a falling histogram inside a rising EMA and confirm the bar is blue, not green.
A worked example with real numbers
The trade below is an illustrative H1 sequence on EURUSD, using the account rules stated at the top: 100,000 dollars, 5,000-dollar daily loss limit, 500-dollar risk per trade. The pip value for one standard lot of EURUSD is 10 dollars, and the position-size formula is the same one used across this site: lots equal risk divided by stop distance in pips times pip value. My EMA guide and MACD guide cover each half of this system in depth; here they work together.
| Bar | Close | EMA 13 direction | Histogram direction | Bar colour | Action |
|---|---|---|---|---|---|
| 1 | 1.0850 | Falling | Falling | Red | Shorts only; I watch, no setup |
| 2 | 1.0875 | Falling | Rising | Blue | Disagreement; no trade, despite the bounce |
| 3 | 1.0900 | Rising | Rising | Green | First green bar; long setup now allowed |
| 4 | 1.0920 | Rising | Rising | Green | Entry: long at 1.0920 |
| 5 | 1.0945 | Rising | Falling | Blue | Momentum fading; tighten stop, no new long |
| 6 | 1.0930 | Rising | Falling | Blue | Exit at first target or breakeven, per plan |
The sizing for the entry on bar 4: entry 1.0920, stop 1.0900, a 20-pip stop. Lots = 500 / (20 x 10) = 2.5 lots. The first target at 1.0960 is 40 pips, worth 2.5 x 40 x 10 = 1,000 dollars, exactly 2R. The blue bar on bar 5 is the exit discipline in action: I move the stop to breakeven and take the first target rather than waiting for a larger one, because the agreement that justified the trade has ended.
Compare that with my old blue-bar trade, the one that opened this article. Same 500-dollar risk, same 20-pip stop, but entered while the EMA was falling and only the histogram was rising. Price stalled at the falling EMA, reversed 25 pips, and the loss was the full 500 dollars plus the spread — and, worse, it put me in the revenge-trade mood that cost a second 500 dollars the same morning. Two blue-bar trades, 1,000 dollars, 20 percent of the daily limit, before lunch. The Impulse System’s contribution is not that it finds winners; it is that it forbids exactly that morning.
I tested it: ten filtered trades against ten unfiltered ones
I ran a simple comparison over twenty H1 setups on EURUSD and GBPUSD that I had already marked as tradeable on price structure alone. Ten were taken only when the bar colour agreed with the setup direction; ten were taken regardless of colour, the way I used to trade. The risk per trade was 500 dollars in both sets, and the results are shown in R multiples, where 1R equals 500 dollars. This is my own journal test, not a backtest over thousands of trades, and it proves a discipline point rather than a statistical edge — but the gap is the reason the blue-bar rule is now non-negotiable for me.
| Set | Trades | Wins | Losses | Average win | Net result | Net in dollars |
|---|---|---|---|---|---|---|
| Colour-filtered (green for longs, red for shorts) | 10 | 6 | 4 | 1.8R | +6.8R | +3,400 dollars |
| Unfiltered (blue bars allowed) | 10 | 3 | 7 | 1.5R | -2.5R | -1,250 dollars |
The filtered maths: 6 wins at 1.8R give 10.8R, minus 4 losses at 1R gives 6.8R, and 6.8 x 500 = 3,400 dollars. The unfiltered maths: 3 wins at 1.5R give 4.5R, minus 7 losses at 1R gives -2.5R, and -2.5 x 500 = -1,250 dollars. The win rate did not need to be spectacular; removing the disagreement trades removed most of the losses. That is the funded-account lesson in one line: on a 5,000-dollar daily limit, avoiding four avoidable 500-dollar losses matters more than finding one extra winner. If your own journal shows the same pattern — blue-bar trades losing more often than green and red ones — the filter is paying for itself, and the Profit Split Calculator will show what keeping those dollars does to your payout over a year.
Common mistakes, and how the system fits prop-firm rules
The first mistake is treating blue as a weaker green. It is not. Blue is the system saying “I do not know”, and trading through “I do not know” is how funded accounts die quietly, one full-risk loss at a time. The second mistake is trading every green bar. Green is permission, not an entry: you still need a setup — a pullback, a level, a structure — and green only confirms it. The third mistake is using the system on a five-minute chart during thin hours, where the EMA and histogram flip colour on single candles and the spread eats the entire impulse. The fourth is moving the stop when a bar turns blue, hoping the colour flips back. Elder’s rule is the opposite: blue after entry means tighten or exit, never widen.
Against prop-firm rules, the system fits unusually well. The daily loss limit is protected by the blue-bar filter and the three-trade cap: three full losses cost 1,500 dollars, leaving 3,500 dollars of room, and a day that starts with two blue-bar refusals is a day that cannot spiral. The consistency rule, which many firms enforce as a cap on how much of your profit can come from one day or one trade, is helped by the exit-fast discipline: banking 2R wins repeatedly produces steadier equity curves than holding for 5R home runs that mostly reverse. Trailing drawdown is helped for the same reason — exits on blue bars lock in part of the move before price gives it back. The one rule the system does not solve is news: a red-data release will paint bars any colour it likes, and no colour rule survives a 100-pip spike, so the session filter in the settings table is mandatory, not optional.
My daily routine with the Impulse System
| Time | Step | What I check |
|---|---|---|
| Before London | Mark H4 direction | H4 bar colour on EURUSD and GBPUSD; H1 trades only in that direction today |
| London open | Wait for agreement | First H1 bar whose colour matches my setup direction; blue bars are skipped, not debated |
| On entry | Size from the stop | 500 dollars divided by stop pips times pip value; never a round lot number chosen by feel |
| During the trade | Watch the next bar’s colour | Blue means move stop to breakeven or take target one; red against a long means exit |
| After 3 trades | Stop for the day | Win or lose, three impulse trades is the cap; the Minimum Trading Days Tracker logs the day either way |
| End of day | Journal the colours | Every skipped blue bar logged beside every taken trade, so the filter’s value stays visible |
That routine is deliberately boring, and boring is the point. A funded account is not a stage for cleverness; it is a machine for converting a small, repeatable edge into payouts without tripping a rule. The Impulse System gives the routine its traffic light, and the traffic light only works if red and blue are obeyed as strictly as green is followed.
Frequently asked questions
Is the Elder Impulse System the same as Elder Ray?
No. Elder Ray measures Bull Power and Bear Power against the 13-period EMA. The Impulse System compares the slope of the 13-period EMA with the slope of the MACD histogram and colours the bar green, red or blue. They share an author and an average, but the calculation and the question are different, and they can be used together: Elder Ray for strength, Impulse for agreement.
Can I trade every green bar as a buy signal?
No, and doing so is the fastest way to misuse the system. Green is permission for a long setup you already have, not an entry by itself. You still need a level, a pullback or a structure, plus a stop sized to your risk cap. Green bars without a setup are just a rising market you are watching.
What should I do when a bar turns blue after I am already in a trade?
Tighten the stop to breakeven or take your first target, depending on your plan — but do not widen the stop and do not add to the position. Blue means the agreement that justified the trade has ended, and funded-account discipline says you exit on the system’s terms, not on hope.
Does the system work on lower timeframes like five minutes?
It colours bars on any timeframe, but on five minutes the colours flip so often that the spread and the noise eat the edge, and the trade count explodes past any sensible daily cap. H1 entries with H4 direction is the funded-account setting; anything faster needs a separate, stricter test in your own journal before it earns real risk.
Why does the system use the histogram’s slope, not whether it is above zero?
Because slope detects change earlier. A histogram below zero but rising gives a green bar at the start of a recovery, and a histogram above zero but falling gives a red bar while price still looks strong. Position above zero tells you where momentum has been; slope tells you where it is going, and funded trades live or die on direction.
How does the Impulse System protect a daily loss limit?
Three ways: the blue-bar filter removes disagreement trades, which in my journal test were the majority of losses; the three-trade daily cap bounds the worst day at 1,500 dollars on a 500-dollar risk; and the exit-on-blue rule banks part of winners before reversals return them. Together they keep a bad day well inside a 5,000-dollar limit.
Risk disclaimer: This guide is for education only and is not financial advice. Trading on a funded account involves risk, including the loss of challenge fees, and past results from a personal journal test do not guarantee future results. Always check your firm’s current rules before trading any indicator system.


