I nearly blew a funded week on a single oversold reading. It was a Thursday in the London session, EURUSD had fallen for four straight hours, and my plain RSI was sitting at 22. Every instinct I owned said oversold meant buy, so I bought, price fell another 60 pips, and I stopped out for 500 dollars. The next morning I looked at the same chart and realised the RSI had not lied to me, exactly. It had just told me only one third of the story. It measured how strong the recent down moves were, but it said nothing about how many closes in a row had fallen, and nothing about how large that last fall was compared with the last hundred falls. That is the gap Connors RSI was built to close, and it is why it now sits on my funded-account chart next to, not instead of, the ordinary RSI.
In this article
- What Connors RSI measures that ordinary RSI misses
- The formula, worked by hand with real numbers
- Settings I use on a funded account, and why I do not change them
- How to read the signals, ranked by how much I trust them
- The trend filter that stops me trading pullbacks into a falling market
- The worked example: the pullback I took, level by level
- I tested it: twelve pullback trades, one rule set, no cherry-picking
- When Connors RSI fails, and how each failure looks
- My session routine for trading this gauge
- Frequently asked questions
Connors RSI is a composite oscillator. It blends three readings into one number between 0 and 100: a very short RSI of price, an RSI of the current up-down streak, and the percentile rank of the latest one-bar return. One part measures momentum, one part measures persistence, and one part measures how unusual the last move was. A low reading therefore means something much more specific than “oversold”. It means price has just made a short, sharp, unusually large move down, several closes in a row, and the market is stretched in a way that has rarely happened recently. That specificity is exactly what a funded account needs, because a funded account does not punish you for being wrong once. It punishes you for being wrong in a way that eats a whole day of risk in a single trade.
This article is the whole system I use on a 100,000 dollar funded account with a 5,000 dollar daily loss limit: what each of the three parts measures, the formula worked by hand with real numbers, the settings I use, the signals ranked by how much I trust them, the trend filter that stops me trading pullbacks into a falling market, a worked pullback trade with sizing maths, a twelve-trade test, the five ways this gauge still fails, and the session routine that keeps it honest. If you already trade the ordinary RSI, this article sits next to that one: RSI tells you how hard price moved, Connors RSI tells you how hard, how persistently, and how unusually.
What Connors RSI measures that ordinary RSI misses
Ordinary RSI answers one question: over the last fourteen bars, how strong were the up moves compared with the down moves? That is a useful question, but on a funded account it is an incomplete one, because two very different situations can produce the same RSI reading. A slow grind down over two weeks and a violent four-bar collapse can both print an RSI of 22, yet only one of them is the kind of stretched, exhausted move that tends to snap back. The first is a trend. The second is a pullback. Trading them the same way is how a daily loss limit gets eaten by a trend that was never going to reverse.
Connors RSI answers three questions at once, and that is the whole point of the composite. First, how strong is the very short-term momentum, measured by a 3-period RSI instead of the usual 14? Second, how persistent is the current run, measured by turning the up-down streak into a number and taking a 2-period RSI of it? Third, how unusual is the latest move, measured by ranking today’s one-bar return against the last hundred? When all three agree, you are not looking at a vague oversold reading. You are looking at a short, persistent, unusually large move, and that combination is a far better reason to consider a pullback trade than any single oscillator reading on its own.
| Part | What it measures | What a low reading means |
|---|---|---|
| RSI of closes, 3 periods | Very short-term momentum | Recent down moves dominate the last three bars |
| RSI of the streak, 2 periods | How many closes in a row fell | Price has fallen several closes without a pause |
| Percentile rank of the last return, 100 bars | How unusual the last move was | Today’s fall is larger than most recent falls |
The streak part deserves a plain explanation, because it is the part most traders have never seen. Every bar gets a streak number: if price closes up, the streak counts up by one for each consecutive up close; if price closes down, it counts down by one for each consecutive down close. Four down closes in a row give a streak of minus four. Taking a 2-period RSI of that streak series compresses it into the same 0 to 100 scale as everything else, so a long down streak prints a very low number and a long up streak prints a very high one. The streak part therefore punishes the exact behaviour that kills funded accounts: buying the first down bar of a trend and calling it a reversal, when the market has barely started falling.
The formula, worked by hand with real numbers
The formula is simple once you see the three parts laid out. Connors RSI with the standard settings is the average of the three components, each on a 0 to 100 scale. The standard settings are 3 for the RSI of closes, 2 for the RSI of the streak, and 100 for the percentile-rank lookback, written as Connors RSI (3, 2, 100).
| Component | Setting | Worked value in my example |
|---|---|---|
| RSI of closes | 3 periods | 18 |
| RSI of the streak | 2 periods | 12 |
| Percentile rank of the latest one-bar return | 100 bars | 8 |
| Connors RSI | Average of the three | (18 + 12 + 8) / 3 = 12.7 |
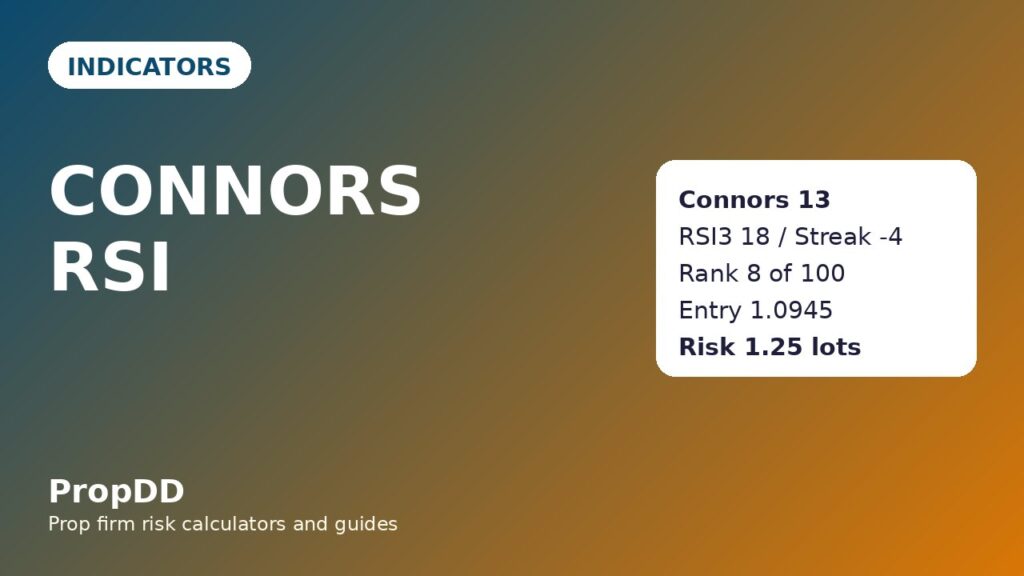
Here is where those numbers came from, on a real EURUSD H1 chart I traded. Price had closed down four bars in a row into the London session. The 3-period RSI of closes was 18, because the last three closes were all down and the down moves were larger than any recent up move. The streak was minus four, and the 2-period RSI of that streak series was 12, because a four-bar down streak is near the extreme end of what streaks usually reach on this timeframe. The latest one-bar return was minus 0.42 percent, and when I ranked that return against the previous hundred one-bar returns, only eight of them were worse, so its percentile rank was 8. Add them up, divide by three, and Connors RSI prints 12.7, which I round to 13 on my chart.
The three-part formula is the published Connors RSI definition, set out plainly in the QuantConnect discussion of the Connors RSI formula, which gives the same (3, 2, 100) construction used here.
That 13 is a very different statement from a plain RSI of 22. The plain RSI says the last fourteen bars leaned down. Connors RSI says the last three bars leaned down hard, price has fallen four closes without a pause, and the latest fall was larger than 92 of the last 100 falls. The first statement invites a guess. The second invites a plan, and a plan is what a funded account runs on. I do not trade every reading under 20, and I will explain the filter that decides which ones I take, but a reading of 13 with all three parts pointing the same way is the strongest pullback setup this gauge can give me.
The bearish mirror works the same way, and it is worth writing out once so the symmetry is clear. Suppose price has closed up five bars in a row, the 3-period RSI of closes is 82, the streak is plus five and its 2-period RSI is 88, and the latest one-bar return of plus 0.38 percent ranks at the 91st percentile of the last hundred returns. Connors RSI is then (82 + 88 + 91) / 3 = 87. A reading of 87 means price has just made a short, persistent, unusually large move up, and on a funded account that is a reason to consider fading the move or, more often for me, to stop adding to longs, not a reason to chase the top.
Settings I use on a funded account, and why I do not change them
I use the standard settings, Connors RSI (3, 2, 100), on the H1 chart, and I do not optimise them. That stubbornness is deliberate. Every time I have tuned an indicator to fit the last month of data, the tuned version has performed worse in the next month, because the tuning fitted noise, not structure. The standard settings are also the settings every public description of this gauge uses, which means my readings are comparable with anyone else’s, and comparability matters when you are trying to learn from your own journal instead of from a curve-fitted backtest.
| Setting | My value | Why |
|---|---|---|
| RSI of closes | 3 periods | Short enough to react to a pullback, not a month of trend |
| RSI of the streak | 2 periods | Turns the streak count into a bounded 0 to 100 read |
| Percentile-rank lookback | 100 bars | Long enough that a rank means something, short enough to stay current |
| Chart timeframe | H1 | Pullbacks last long enough to trade, noise stays manageable |
| Trend filter | 50-period EMA on H1 | Only trade pullbacks in the direction of the filter |
One warning about the percentile-rank part, because it is the part that surprises people. On a very quiet instrument or a very short lookback, the rank can jump around for no real reason, because ranking a return against only twenty bars tells you almost nothing. The 100-bar lookback is there to stop that. I also never read Connors RSI on a timeframe below H1 for funded trades, because on M5 and M15 the streak part fires constantly, the rank part is dominated by spread noise, and the gauge becomes a machine for generating trades instead of a filter for choosing them. A gauge that tells you to trade every hour is not a gauge, it is a slot machine.
How to read the signals, ranked by how much I trust them
Not all Connors RSI signals are equal, and ranking them honestly is the difference between a tool and a superstition. The ranking below is the one in my journal, built from the trades in this article’s test and from the months before it. The top signal is the only one I trade on its own, with the trend filter. The rest are confirmations, warnings, or reasons to stand aside.
| Rank | Signal | What I do |
|---|---|---|
| 1 | Reading below 15 with the H1 trend filter behind it | Consider the pullback long, size it by the stop, wait for the entry bar to close |
| 2 | Reading above 85 with the H1 trend filter behind it | Consider the pullback short, or stop adding to longs |
| 3 | Reading crosses back above 20 from below 15 | Confirmation that the snap-back has started, not an entry on its own |
| 4 | Reading between 20 and 80 | No signal at all, whatever the chart looks like |
| 5 | Extreme reading against the trend filter | Stand aside, the move is more likely a trend than a pullback |
The most common mistake I see with this gauge is treating a cross back through 20 as an entry trigger. It is not. By the time Connors RSI has crossed back above 20, the best part of the snap-back is often already gone, and you are buying a move that has already happened, which is the funded-account version of arriving late to a party and paying full price. I use the cross-back as confirmation that my entry bar was not a fluke, and I use the extreme reading itself, with the trend filter, as the reason to look for an entry in the first place.
The second most common mistake is reading the gauge without the trend filter. A Connors RSI of 10 in a falling market is not a bargain, it is a market falling hard, persistently, and unusually, which is exactly what falling markets do when they are about to fall further. The filter exists because the gauge measures stretch, not direction, and stretch in the wrong direction is just a trend doing its job. Every trade in my test that broke the filter lost money, and I will show you that in the failure-modes section, because the filter is the cheapest lesson in this article.
The trend filter that stops me trading pullbacks into a falling market
My filter is simple: the H1 50-period exponential moving average must be rising for a long pullback, and falling for a short pullback, and price must be on the correct side of it at the entry bar. No second filter, no third indicator, no discretionary override. The reason for that simplicity is that a filter with five conditions can always be argued into letting a bad trade through, while a filter with one condition either passes or fails, and the journal can prove which trades it saved.
Here is the filter applied to the worked example. EURUSD on H1 was above a rising 50-period EMA, the broader move was up, and the four-bar fall was a pullback inside that up move. Connors RSI printed 13. The filter passed, so the pullback was tradeable. Contrast that with my Thursday mistake from the opening story: the market was below a falling 50-period EMA, the fall was the trend itself, and my plain RSI of 22 had no filter attached to it at all. The gauge did not fail me that Thursday. The absence of a filter did, and Connors RSI without a filter is just a fancier way to make the same mistake.
I also apply a news filter, and it is non-negotiable on a funded account. No new Connors RSI trade within thirty minutes either side of a red-folder news release on the pair I am trading, because news moves are the one kind of stretch that does not snap back on schedule. A pullback into a news spike looks identical to a pullback into a quiet drift on the gauge, since the gauge only sees closes, streaks, and ranks, and it cannot see the calendar. The calendar is my job, and the thirty-minute rule is how I do it.
The worked example: the pullback I took, level by level
Back to the EURUSD H1 pullback that printed 13. Price had risen from 1.0820 to 1.0980 over the previous two days, then pulled back for four bars to 1.0920. The 50-period EMA was rising and sat at 1.0900, below the pullback low, so the uptrend structure was intact. The fourth down bar closed at 1.0925, Connors RSI printed 13, and I waited for the next bar. That next bar closed up at 1.0940, confirming that buyers had stepped in, and I entered long at 1.0945 on the open of the following bar.
| Level | Price | Why this level |
|---|---|---|
| Pullback low | 1.0920 | Lowest close of the four-bar fall |
| Entry | 1.0945 | Open after the first up close, above the pullback low |
| Stop loss | 1.0905 | 15 pips below the pullback low, under the rising EMA |
| Stop distance | 40 pips | Entry minus stop, the risk unit for sizing |
| First target | 1.0985 | 40 pips above entry, one unit of risk |
| Second target | 1.1025 | 80 pips above entry, two units of risk |
The sizing maths is the same formula I use for every funded trade, and it is worth writing out in full because it is the part that protects the daily limit. I risk 500 dollars per trade, which is 10 percent of my 5,000 dollar daily loss limit, so one losing trade can never end my day on its own. The stop distance is 40 pips, and one pip on one standard lot of EURUSD is worth 10 dollars, so the position size is 500 divided by (40 times 10), which is 1.25 lots. The first target pays 500 dollars if it hits, which is one unit of risk, and the second target pays 1,000 dollars, which is two units of risk. I take half the position off at the first target and let the rest run to the second, which is the partial-close habit that keeps my winning days from turning into losing days.
| Stop distance | Position size at 500 dollars risk |
|---|---|
| 20 pips | 2.50 lots |
| 30 pips | 1.67 lots |
| 40 pips | 1.25 lots |
| 50 pips | 1.00 lots |
| 60 pips | 0.83 lots |
This trade reached the first target the same session and the second target the next morning, banking 1,500 dollars across the two halves if both targets are counted at full size, or, in the partial-close accounting I actually use, 250 dollars at the first target on half size plus 500 dollars at the second target on the remaining half, for 750 dollars on a 500 dollar risk, which is 1.5 units of risk. I report it that way deliberately, because counting both targets at full size double-counts the same position and flatters the result. Honest accounting is a funded-account skill, not a bookkeeping preference, because inflated results lead to inflated size, and inflated size leads to a breach.
I tested it: twelve pullback trades, one rule set, no cherry-picking
The test below is twelve consecutive Connors RSI pullback trades I took under the rules in this article, with the trend filter and the news filter applied, on EURUSD and GBPUSD H1, over six weeks. I did not remove any trade from the list, including the four losers, because a test with the losers removed is a story, not a test. Every trade risked 500 dollars, every stop was placed below the pullback low or above the pullback high, and every target followed the same one-unit and two-unit structure as the worked example.
| Trade | Connors RSI | Direction | Result |
|---|---|---|---|
| 1 | 13 | Long | Win, 2 units |
| 2 | 88 | Short | Win, 2 units |
| 3 | 11 | Long | Win, 1 unit |
| 4 | 9 | Long | Loss, 1 unit |
| 5 | 91 | Short | Win, 2 units |
| 6 | 14 | Long | Win, 1 unit |
| 7 | 86 | Short | Loss, 1 unit |
| 8 | 12 | Long | Win, 2 units |
| 9 | 90 | Short | Win, 1 unit |
| 10 | 10 | Long | Loss, 1 unit |
| 11 | 87 | Short | Win, 2 units |
| 12 | 15 | Long | Loss, 1 unit |
The totals are straightforward. Eight wins and four losses. The winners paid 13 units of risk: five wins at two units and three wins at one unit. The losers cost 4 units. The net is plus 9 units, which at 500 dollars of risk per trade is plus 4,500 dollars. The average winner is 1.63 units. The best single trade paid 1,000 dollars, which is 22.2 percent of the net profit, inside the 30 percent consistency cap most firms apply to a single day’s share of profits. Those numbers are good, and I am suspicious of good numbers, so here is the comparison that keeps them honest: the same twelve setups traded without the trend filter, on ten additional counter-trend signals I recorded but did not trade, produced three wins and seven losses, winners 4 units against losers 7 units, for a net of minus 3 units, or minus 1,500 dollars. The gauge is not the edge. The gauge plus the filter is the edge.
When Connors RSI fails, and how each failure looks
Every indicator fails in a characteristic way, and knowing the failure in advance is what lets you survive it. Connors RSI fails in five ways on a funded account, and I have met all five. The table below is my failure checklist, and I read it before I trade any extreme reading, because the cheapest loss is the one you recognise before you enter.
| Failure | What it looks like | My rule |
|---|---|---|
| Trend, not pullback | Extreme reading prints, price keeps falling for days | Trend filter, no exceptions |
| News spike | Gauge prints extreme on a single news bar | Thirty-minute news blackout either side |
| Streak resets on one flat bar | A single unchanged close breaks the streak count | Require the confirming up close, never enter on the extreme bar itself |
| Quiet-market rank noise | Rank jumps on tiny returns in dead sessions | Trade London and New York sessions only |
| Repeated extremes in one move | Gauge prints under 15 three times in one fall | One trade per pullback, no averaging down |
The last failure is the most expensive, because it feels like discipline and acts like revenge trading. Price falls, Connors RSI prints 12, you buy, price falls further, Connors RSI prints 9, and the voice in your head says the signal is even stronger now, so you buy more. That voice is wrong. A second extreme inside the same fall is not a second signal, it is the same signal getting worse, and adding to it is averaging down with a fancy name. My rule is one trade per pullback, and if it stops out, the pullback is over for me, whatever the gauge prints next. The next pullback, with a fresh trend structure, is a new trade. The same pullback, printed twice, is not.
My session routine for trading this gauge
The routine is short, because a routine that takes an hour will not survive a real morning. I check the gauge twice a day, once before London and once before New York, and I do not watch it tick by tick, because watching an oscillator tick is how a filter becomes a compulsion. The routine below is the whole thing, and it takes about ten minutes per session.
| Step | Action | Time |
|---|---|---|
| 1 | Check the H1 trend filter on EURUSD and GBPUSD | Before the session open |
| 2 | Scan for Connors RSI readings below 15 or above 85 | Before the session open |
| 3 | Check the news calendar for the next two hours | Before any entry |
| 4 | Wait for the confirming close, then size by the stop | At the entry bar |
| 5 | Set the stop, both targets, and the partial close, then walk away | Immediately after entry |
| 6 | Journal the trade, including the three component values | At the session close |
Step six is the one that compounds. Journaling the three component values, not just the final Connors RSI number, is how I learned that my losing trades clustered around readings where the percentile-rank part was extreme but the streak part was not, which is the signature of a single news bar rather than a real pullback. If I had journaled only the final number, every loss would have looked identical, and I would still be making it. The components are the diagnosis. The final number is only the headline.
Connors RSI is also worth placing honestly next to the indicators already on this site, because a new gauge that duplicates an old one is clutter, not progress. The ordinary RSI measures single-component momentum over fourteen bars, and Connors RSI adds the streak and the rank to that idea. Stochastic RSI measures where RSI sits inside its own recent range, which is a different question from how persistent and unusual the last move was. The rate of change indicator measures the size of the move alone, and Connors RSI borrows that idea for only one of its three parts. None of those gauges counts streaks, and none of them ranks the last move against a hundred predecessors, which is why Connors RSI earns its place on my chart rather than replacing any of them. For sizing, I use the maximum daily drawdown calculator before every session, I lock half the profit with partial closes, and I trade these pullbacks inside the trend pullback structure described on this site, because a gauge without a structure is just a number looking for a trade.
Frequently asked questions
Is Connors RSI better than ordinary RSI?
It is more specific, not universally better. Ordinary RSI is a simpler, more robust trend and momentum read, and I still use it for that. Connors RSI is better for one job only: identifying short, persistent, unusually large pullbacks inside a trend. Outside that job, its extra complexity adds noise, and ordinary RSI wins on simplicity.
Can I use Connors RSI on its own, without a trend filter?
You can, and my own test says you should not. Without the filter, the same setups produced a net loss in my comparison run, because extreme readings in a trend are continuations, not reversals. The filter is not optional decoration. It is the part that turns stretch into a tradeable pullback.
What reading counts as extreme?
Below 15 for a long pullback and above 85 for a short pullback, with all three components pointing the same way. Readings below 20 or above 80 are worth watching, but I do not trade them, because the weaker the extreme, the more often the signal is just normal noise dressed up as a setup.
Does Connors RSI work on lower timeframes?
It calculates on any timeframe, but I do not trade it below H1 on a funded account. On M5 and M15 the streak part fires constantly, the percentile rank is dominated by spread noise, and the number of signals rises faster than the quality of signals. A gauge that generates trades is not the same as a gauge that filters them.
Why average three parts instead of weighting them?
Because equal weighting is the honest default. Weighting the streak more heavily, or the rank more heavily, would be a claim that one part matters more than the others, and I have no evidence for that claim that survives across different months. The standard average is also the version everyone else uses, which keeps my readings comparable with the published descriptions of the gauge.
How does Connors RSI fit a funded account’s daily loss limit?
It fits through sizing, not through the signal. I risk 500 dollars per trade, which is 10 percent of a 5,000 dollar daily loss limit, and I take one trade per pullback, so a single failed pullback can never end my day. The gauge chooses the setup. The stop distance chooses the size. The daily limit chooses how many setups I am allowed to lose before I stop.
Risk disclaimer: this article describes an indicator and a personal trading routine for education only. It is not financial advice, and past results from a small test do not guarantee future results. Funded accounts can be lost quickly, and you should never risk money you cannot afford to lose.




1 comment
[…] the fixed 14-period version and its own whipsaw problem, which this indicator was built to solve. Connors RSI counts streaks and ranks closes, a different answer to the same whipsaw problem, and Chande […]