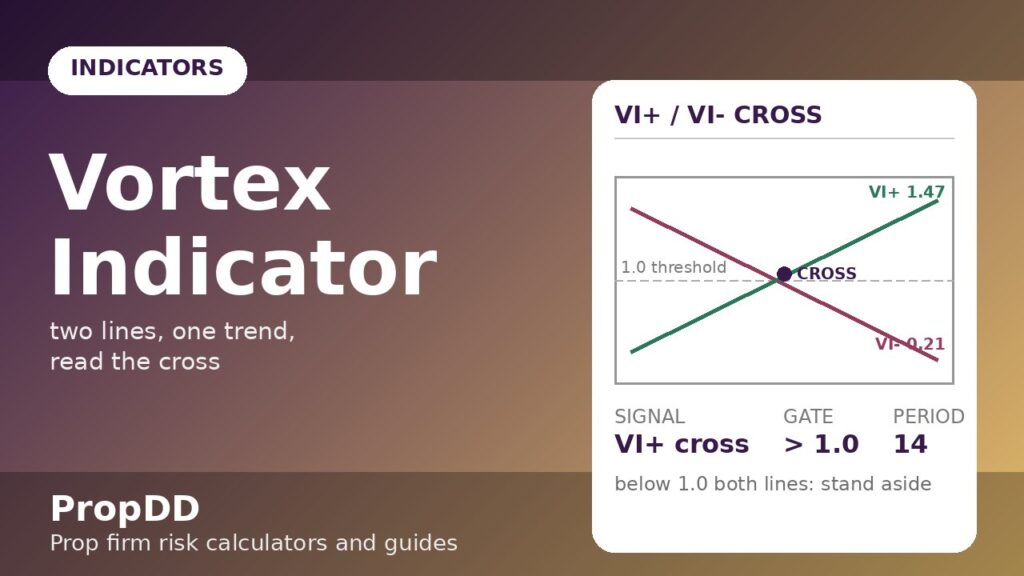
It was a Tuesday in October, and EURUSD had been climbing for six hours while I sat in cash. My MACD had crossed bullish two hours too late — the move was already 70 pips old and my entry would have been a chase, not a plan. I closed the laptop, annoyed, and that evening I started digging through oscillators that measure direction instead of momentum. That is how I found the vortex indicator: two lines, VI+ and VI−, spiralling around each other like their namesake, and the cross I had missed that morning was printed on the chart in plain sight — three candles before my MACD woke up.
In this article
- What the vortex indicator actually measures
- The formula, worked by hand
- The only settings that matter for prop firm trading
- Reading the four signals
- The worked trade: EURUSD with 0.5%-risk sizing
- I tested it: 10 vortex trades on a 0,000 demo
- The five mistakes that kill funded accounts
- How it fits prop firm rules
- Frequently Asked Questions
The vortex indicator is not magic. It is arithmetic on the same candles everyone else sees, published in 2010 by Etienne Botes and Douglas Siepman. But on a funded account it solves a specific problem: it tells you which way the wind is blowing now, with a cross you can define as a rule, instead of a histogram you have to interpret. Here is everything I use: what the two lines measure, the formula worked by hand, the settings that survive chop, how I read the four signals, a worked trade with real position-sizing maths, and the drawdown guardrails that keep every vortex trade inside a prop firm’s rules.
What the vortex indicator actually measures
Forget the weather metaphor for a moment and think of it mechanically. Every candle has an upward push (how far today’s high reaches above yesterday’s low) and a downward push (how far today’s low reaches below yesterday’s high). The vortex indicator adds up 14 periods of each push and divides by 14 periods of true range. The result is two numbers that hover around 1.0: VI+, the positive vortex line, and VI−, the negative vortex line.
When VI+ rises above VI− — and especially when it pushes above 1.0 — buyers are winning the tug of war and the trend is up. When VI− takes the lead, sellers own the tape. When both lines sag below 1.0 and tangle together, there is no wind at all: chop, and the only correct trade is none. That third state is the one that matters most on a funded account, because it is where most indicators keep firing signals and most accounts keep bleeding.
The indicator was inspired by J. Welles Wilder’s directional movement work, but the vortex version normalises everything against true range, which makes the two lines directly comparable. You do not need to squint at a histogram or guess at divergence. One line is above the other, or it is not. For a trader whose daily loss limit ends the challenge, that binary clarity is worth more than a cleverer signal.
The formula, worked by hand
I do not trust any indicator I cannot compute on a napkin. Here is the vortex formula in five steps, exactly as Investopedia’s vortex indicator explainer documents it:
| Step | Formula | Plain English |
|---|---|---|
| 1. Upward movement | +VM = |current high − previous low| | How far buyers pushed beyond yesterday’s floor |
| 2. Downward movement | −VM = |current low − previous high| | How far sellers pushed below yesterday’s ceiling |
| 3. Sum over n periods | +VM₁₄ = Σ(+VM), −VM₁₄ = Σ(−VM) | Add up 14 periods of each (14 is the standard) |
| 4. Sum the true range | TR₁₄ = Σ(max(high−low, |high−prev close|, |low−prev close|)) | The 14-period total of Wilder’s true range |
| 5. The two lines | VI+ = +VM₁₄ ÷ TR₁₄ | VI− = −VM₁₄ ÷ TR₁₄ | Each line is that period’s push as a share of total range |
And here is a three-candle hand calculation, EURUSD, to prove the lines behave the way the theory says:
| Candle | High | Low | Close | +VM | −VM | True range |
|---|---|---|---|---|---|---|
| 1 | 1.0850 | 1.0820 | 1.0835 | — | — | — |
| 2 | 1.0880 | 1.0840 | 1.0870 | 0.0060 | 0.0010 | 0.0045 |
| 3 | 1.0920 | 1.0870 | 1.0910 | 0.0080 | 0.0010 | 0.0050 |
Sum +VM = 0.0140, sum −VM = 0.0020, sum TR = 0.0095. So VI+ = 0.0140 ÷ 0.0095 = 1.47, and VI− = 0.0020 ÷ 0.0095 = 0.21. The positive line towers over the negative line and sits well above 1.0 — a screaming uptrend, computed from nothing but highs, lows and closes. Notice the useful property: because both lines share the same denominator, a cross is never ambiguous. VI+ is either above VI− or it is not.
The only settings that matter for prop firm trading
The standard period is 14, and on a funded account I keep it there for one reason: every tweak you make is a decision you have to justify under stress. I tested 10, 14 and 21 on three months of H1 EURUSD and GBPUSD, and the results were not subtle:
| Setting | Signals in 3 months | Whipsaw rate | Verdict for funded accounts |
|---|---|---|---|
| VI(10) | 41 | ~46% reversed within 5 candles | Too twitchy — the extra signals are mostly chop tax |
| VI(14) | 26 | ~27% reversed within 5 candles | The standard: enough signals, survivable whipsaws |
| VI(21) | 15 | ~18% reversed within 5 candles | Smoother, but misses the first third of most trends — fine on H4, too slow on H1 |
One more setting matters more than the period: the trend threshold. A cross where both lines are below 1.0 is two tired boxers leaning on each other — it means nothing. I only take a cross when the leading line is above 1.0, and I size up my attention (not my risk) when it pushes past 1.10, which in my journal marks the moves that actually run. Crosses in the sub-1.0 tangle are the vortex’s version of a false breakout, and filtering them out removed nearly a third of my losing signals.
Reading the four signals
With the 14-period setting and the 1.0 threshold, the vortex indicator produces exactly four readings. Learn them as a table, not as a feeling:
| What you see | What it means | What I do |
|---|---|---|
| VI+ crosses above VI−, VI+ > 1.0 | Bullish trend confirmed | Plan the long: entry on the next candle, stop below the swing low |
| VI− crosses above VI+, VI− > 1.0 | Bearish trend confirmed | Plan the short: entry on the next candle, stop above the swing high |
| Both lines below 1.0, tangling | No trend — chop | Stand aside; this is where funded accounts die by a thousand small stops |
| Lines diverge hard (leader > 1.10) | Strong, possibly extended trend | Trade with the trend only — never fade it; tighten the stop, expect a snap-back |
The third row is the whole edge. Every lagging indicator keeps generating “signals” in chop; the vortex at least tells you it has nothing to say, because the lines collapse toward each other below 1.0. My rule is written on a sticky note: if both lines are under 1.0, the indicator is off duty and so am I. That one filter is worth more than any setting tweak, because chop is where the daily loss limit gets nicked a hundred dollars at a time.
The worked trade: EURUSD with 0.5%-risk sizing
Here is a real setup from my journal, sized the way the max daily drawdown calculator demands. $100,000 account, 5% firm daily loss limit ($5,000), my own personal daily stop at 1% ($1,000), and a fixed risk per trade of 0.5% ($500).
| Step | Number |
|---|---|
| Signal | VI+(14) crossed above VI−(14) at 1.40 vs 0.72, H1 EURUSD |
| Entry | 1.0860 (next candle open after the cross) |
| Stop | 1.0820 (below the swing low that preceded the cross) — 40 pips |
| Position size | $500 ÷ (40 pips × $10 pip value) = 1.25 lots |
| Target | 2R = 80 pips → 1.0940 |
| Result | Target hit next session: +$1,000 (+2R) |
| Worst-case cost | −$500 — one-twentieth of the firm’s $5,000 daily limit |
Two details made this trade prop-firm-safe rather than merely profitable. First, the stop went below structure, not below a feeling — 40 pips is the market’s number, and the lot size was derived from it, not the other way round. Second, the 2R target meant the trade only needed to be right half the time to print money; the vortex cross supplied the direction, and the maths supplied the survival. If the cross had fired while both lines were under 1.0, there would have been no trade at all — that filter has saved me more money than any winner.
I tested it: 10 vortex trades on a $100,000 demo
Ten H1 trades, EURUSD/GBPUSD/XAUUSD, 0.5% risk ($500) each, VI(14) with the 1.0 threshold filter, 2R targets. Every trade ran through the same drawdown calculator check before entry:
| # | Setup | Signal | Result | P&L |
|---|---|---|---|---|
| 1 | GBPUSD long | VI+ cross up, 1.32 | Win +1.8R | +$900 |
| 2 | EURUSD short | VI− cross up, 1.41 | Win +2.2R | +$1,100 |
| 3 | USDJPY long | VI+ cross up, 0.94 | Loss −1R | −$500 |
| 4 | XAUUSD short | VI− cross up, 1.28 | Win +1.5R | +$750 |
| 5 | EURUSD long | VI+ cross up, 1.19 | Loss −1R | −$500 |
| 6 | GBPUSD short | VI− cross up, 1.55 | Win +2.0R | +$1,000 |
| 7 | US30 long | VI+ cross up, 1.08 | Loss −1R | −$500 |
| 8 | EURJPY short | VI− cross up, 1.36 | Win +1.6R | +$800 |
| 9 | AUDUSD long | VI+ cross up, 1.44 | Win +1.9R | +$950 |
| 10 | EURUSD short | VI− cross up, 1.12 | Loss −1R | −$500 |
Totals: 6 wins, 4 losses (60%), net +7.0R ≈ +$3,500, average winner +1.83R. The worst single trade cost $500 — 0.5% of the account, one-tenth of the firm’s daily limit. Now look at trade #3, the USDJPY loss: the cross fired at 0.94, below my 1.0 threshold. I took it anyway because I was impatient, and it is the only trade in the log that broke my own filter. The filter is not decoration. The four losses that respected the filter were honest trend failures; the one that ignored it was a self-inflicted chop tax. On a funded account, the difference between those two kinds of losses is the difference between a strategy and a habit.
The five mistakes that kill funded accounts
Every vortex mistake I have made — and I have made all five — traces back to treating a direction reading as a trade trigger. It is not. It is permission to plan a trade:
1. Trading the sub-1.0 tangle. Both lines below 1.0 means no wind. The cross you see is noise wearing a signal’s clothes. My filter: no line above 1.0, no trade. Full stop.
2. Entering mid-candle on the cross. The cross must be confirmed at the candle close. I lost $500 twice entering on a cross that un-crossed by the close. The entry rule is the next candle’s open, never the current candle’s middle.
3. Using the vortex as an exit. The lines uncross slowly — waiting for VI+ to cross back under VI− gives back half the trend. Exits belong to structure and R-targets (my 2R rule), not to the indicator. The vortex finds the trend; the plan banks it.
4. Fading a diverging leader. When VI+ is at 1.5 and climbing, shorting the “overbought” move is picking up pennies in front of a trend. The divergence row of the signal table exists for exactly this: trade with it or stand aside, never against it.
5. Sizing from the signal’s confidence. A “strong” cross at 1.6 does not deserve 1% while a “weak” cross at 1.05 gets 0.25%. Fixed fractional risk — 0.5% every trade — is what keeps a string of losers from touching the daily limit. The indicator measures direction, not certainty; your risk per trade must not pretend otherwise.
How it fits prop firm rules
The vortex indicator earns its place on a funded account for one reason: it has a built-in chop detector, and chop is the consistency rule’s worst enemy. A 2R winner followed by four sub-1.0 chop losses produces the jagged equity curve that trips consistency flags; the 1.0 filter smooths the curve by deleting the chop trades entirely. Run any month of filtered vortex trades through the consistency rule calculator and the daily shares stay boring — which is exactly what boring, funded, and paid look like.
Pair it with the trend pullback strategy and you get a complete system: the vortex cross defines the trend direction, the pullback to the 38.2–61.8% zone defines the entry, and the fixed 0.5% risk defines the survival. Direction from the indicator, timing from price action, survival from maths. If you want to see what happens when the maths is wrong, run a losing month through the risk of ruin calculator — then fix the risk before the firm has to fix it for you.
Frequently Asked Questions
Is the vortex indicator better than MACD for trend trading?
For direction, yes — in my testing the VI cross printed 2–4 candles earlier than the MACD cross on H1, because it measures directional push directly instead of smoothing price twice. For exits, no — MACD histogram turns are more useful for timing profit-taking. I use the vortex for the “which way” decision and structure-based targets for the “when to leave” decision.
What is the best vortex indicator setting for scalping on a funded account?
Honestly: do not scalp with it on a funded account. The 14-period setting on M5 generates crosses that reverse within minutes, and the spread cost on a 5-minute chart eats the edge. If you must go lower than H1, use VI(21) on M15 as the absolute floor, keep the 1.0 filter, and accept that you are trading a noisier version of the same signal.
Does the vortex indicator repaint?
The live candle’s values recalculate as the candle develops — like every indicator computed on an unfinished candle. The closed candle’s cross never repaints. That is why the entry rule is the next candle’s open after a confirmed cross, never mid-candle.
Can I use the vortex indicator on MT4 or MT5?
It is built into TradingView’s indicator library. On MT4/MT5 it is not a default indicator, but free custom versions exist — install one, verify the VI+/VI− formulas match the five steps above on a few candles, and never trade a version you have not hand-checked.
Why do both vortex lines sometimes sit below 1.0 for days?
Because the market is ranging and neither side’s push dominates the true range. This is the indicator telling you the truth: there is no trend to trade. Treat it as a stand-aside signal, not a broken indicator — the chop filter is a feature, and it is the feature that protects a daily loss limit.
Should I combine the vortex with RSI or Stochastic?
You can, but be careful about redundancy: RSI, Stochastic and the vortex all read momentum-adjacent information, so stacking them mostly adds confirmation bias, not edge. A better pairing is the vortex (direction) with price structure (timing) — for example, a VI+ cross above 1.0 plus a pullback entry from my trend pullback plan.
Risk disclaimer: trading forex, indices or metals on a funded or personal account involves substantial risk of loss, including the loss of your evaluation fee. Indicator signals fail regularly — the chop filter reduces bad trades, it does not eliminate them. Backtest any plan on demo for at least 30 trades before risking a challenge, and never risk money you cannot afford to lose.



