I lost a funded account to a trend that was not really a trend. EURUSD had been climbing for nine days, every green candle felt like confirmation, and I kept buying every small dip because the chart looked like a staircase. What I did not see was that each new high was smaller than the last, price was spending more and more time below its average, and the trend I was trading had already run out of strength. The last dip I bought never came back. It fell 90 pips, took my daily limit with it, and the account was gone before lunch.
In this article
- What the Trend Intensity Index measures, and what it does not
- The formula, worked slowly so you can check it
- How I read the score: the three zones that run my trading
- The best settings for prop-firm trading
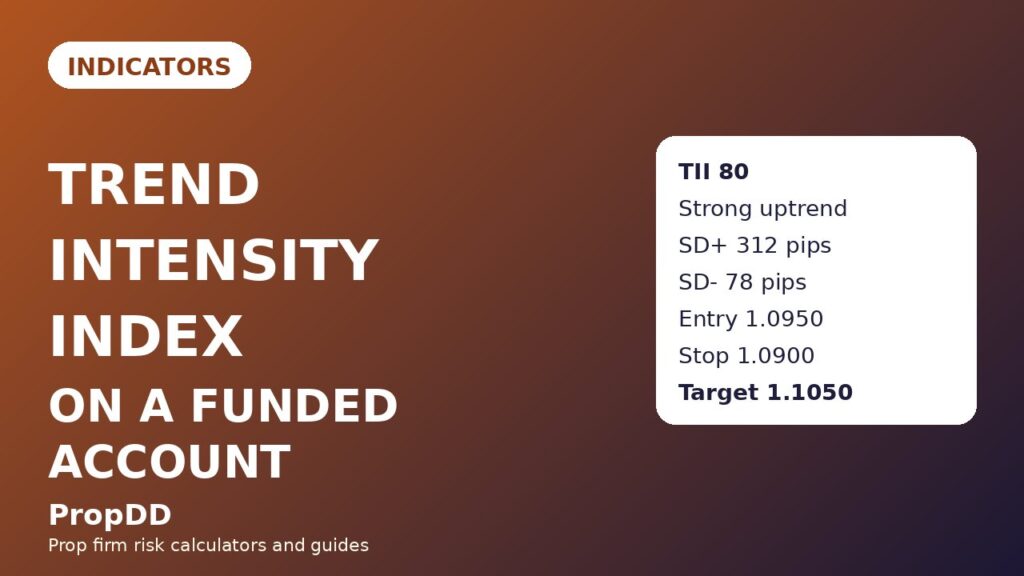
- My worked trade: the EURUSD long at a TII of 80
- The sizing grid: what changes when the reading changes
- I tested it: twelve filtered trades against twelve unfiltered ones
- Common mistakes, including the ones I still make
- My daily routine with the Trend Intensity Index
- Frequently asked questions
That loss sent me looking for a number that measures trend strength itself, not trend direction. Direction is easy: price above an average is up, below it is down. Strength is the question that actually matters on a funded account, because a weak trend is where dip-buyers get trapped and a strong trend is where patience pays. The Trend Intensity Index gives me that number on a scale from 0 to 100, and this guide is the funded-trader version I use now: what it measures, its exact formula, the settings I run, how I read its signals, one worked trade with every number shown, and the mistakes that still catch me out.
What the Trend Intensity Index measures, and what it does not
The Trend Intensity Index, usually shortened to TII, answers one question: over the last 30 bars, how much of price’s distance from its moving average was above that average, and how much was below it? If almost all the distance was above, the trend is strongly up. If almost all of it was below, the trend is strongly down. If the distance is split evenly, there is no trend worth trading, whatever the chart looks like at a glance.
That is a different job from most indicators I already use. RSI tells me whether price has moved too far too fast. MACD tells me whether momentum is speeding up or slowing down. TII tells me whether the trend itself has weight behind it. A market can have a high RSI and a weak TII at the same time — overbought inside a trend that is already dying — and that combination is exactly the trap I fell into on EURUSD. I cover RSI’s own funded-account rules in my RSI guide, and the two read very differently side by side.
What TII does not do is predict reversals on its own. A reading of 85 does not mean price must fall, and a reading of 15 does not mean it must rise. Extreme readings mean the trend is strong, and strong trends last longer than tired traders expect. I use TII as a permission filter — it tells me which trades I am allowed to take — not as an entry trigger by itself.
The formula, worked slowly so you can check it
TII was developed by M. H. Pee and published in Stocks and Commodities magazine, and a clear walkthrough of its calculation and interpretation is available for cross-checking. The standard version uses 30 periods against a 60-period simple moving average, and the maths is simple enough to do on a napkin. First you find the 60-period simple moving average. Then, for each of the last 30 closes, you measure how far that close sits from the average. Closes above the average give you up deviations; closes below give you down deviations. Add each group separately, then divide.
| Step | What you do | My worked numbers |
|---|---|---|
| 1. The average | 60-period simple moving average of closes | EURUSD 60 SMA: 1.0920 |
| 2. Up deviations | For each of the last 30 closes above the average, subtract the average from the close, and add them up | Sum of up deviations (SD+): 312 pips |
| 3. Down deviations | For each of the last 30 closes below the average, subtract the close from the average, and add them up | Sum of down deviations (SD-): 78 pips |
| 4. The index | TII = SD+ divided by (SD+ plus SD-) times 100 | 312 / (312 + 78) x 100 = 80 |
That final number, 80, is the whole story of that EURUSD stretch in one figure: 80 percent of the last 30 bars’ distance from the average was above it. The formula rewards persistence, not single big candles. One huge green candle cannot push TII to 80 on its own, because 29 other bars still count. That is why I trust it more than a glance at the chart: it cannot be fooled by one dramatic day.
How I read the score: the three zones that run my trading
TII lives between 0 and 100, and I only really use three zones. The classic rule, straight from Pee’s original work, is that a trader planning to go long wants TII above 80, and a trader planning to go short wants it below 20. I keep those thresholds, but I add a middle rule of my own: between 40 and 60, I do not take trend trades at all.
| TII reading | What it means | What I do on a funded account |
|---|---|---|
| Above 80 | Strong uptrend: most recent distance is above the average | Longs only, on pullbacks to the average or a support level |
| 60 to 80 | Uptrend building, not yet confirmed strong | Half size at most, and only with a second confirmation |
| 40 to 60 | No trend: distance split evenly above and below | No trend trades; range tactics only, or nothing at all |
| 20 to 40 | Downtrend building, not yet confirmed strong | Half size at most, and only with a second confirmation |
| Below 20 | Strong downtrend: most recent distance is below the average | Shorts only, on rallies to the average or a resistance level |
The 50 line is the trend’s centre of gravity. Crosses above 50 tell me buyers are starting to dominate the distance; crosses below 50 tell me sellers are. But I do not trade the cross itself. A cross from 48 to 52 is noise, and noise is what eats a daily limit one small loss at a time. I wait for the move to 80 or 20, or I stay out. On a funded account, staying out is a position, and it is the one that never breaches anything.
The best settings for prop-firm trading
The default 30-period TII against a 60-period average is where I started, and it is where I stayed. Shorter settings, like a 10-period TII, react faster but whip around in exactly the choppy conditions that kill funded accounts. Longer settings, like 50 periods, are smoother but so slow that the trend is half over before the reading confirms it. Thirty against sixty is the balance point: fast enough to catch a real trend, slow enough to ignore a three-day blip.
Timeframe matters more than most traders admit. On the H1 chart, TII flips zones several times a week, and each flip tempts you into a trade. On the daily chart, it flips a few times a month, and each flip means something. I read TII on the daily chart for direction and permission, then drop to H1 only to time the entry. If the daily TII is 78, I am not shorting the H1 chart no matter how clean the setup looks.
One practical note: most platforms do not ship TII as a built-in indicator, so I calculate it in a spreadsheet from exported closes, or use a community script that implements Pee’s formula exactly. Before trusting any script, I check it against the hand calculation in the table above — 312 and 78 must give 80 — because a script that averages the deviations instead of summing them will give a different, useless number.
My worked trade: the EURUSD long at a TII of 80
Here is the trade as it actually happened, with the sizing tied to the daily limit rather than to gut feel. My account was 100,000 dollars with a 5 percent daily loss limit, which is 5,000 dollars. My personal rule is to risk no more than 0.5 percent of the account on one trade, which is 500 dollars. That is the number everything else hangs from, and I check it on the max daily drawdown calculator before I open anything.
| Trade element | Value | Why |
|---|---|---|
| Daily TII | 80 | Strong uptrend confirmed: longs only |
| Entry | 1.0950 | Pullback to the rising 60-period average zone |
| Stop loss | 1.0900 (50 pips) | Below the pullback low and the average |
| Target | 1.1050 (100 pips) | 2R, at the last swing high |
| Risk | 500 dollars | 0.5 percent of a 100,000-dollar account |
| Position size | 1.0 lot | 500 divided by (50 pips x 10 dollars per pip) |
| Outcome | Target hit: plus 1,000 dollars | 2R, and only 20 percent of the daily limit was ever at risk |
The key detail is the order of decisions. TII gave permission first. The pullback gave the entry second. The daily limit gave the size third. Most traders I know do it backwards: they pick a size, then look for a reason. When TII is below 80, I do not get to step two at all, and that is the whole point of having a filter. A filter that never says no is decoration.
The sizing grid: what changes when the reading changes
I do not size every TII trade the same way, because not every reading deserves the same risk. The grid below is the one taped to my monitor, and it is built on the same 5,000-dollar daily limit and 0.5 percent standard risk. A weaker reading gets less risk, not more, because a weaker trend is where my edge is thinnest.
| TII zone | Risk per trade | Size on a 50-pip stop | Daily loss if stopped twice |
|---|---|---|---|
| Above 80 or below 20 | 500 dollars (0.5 percent) | 1.0 lot | 1,000 dollars (20 percent of the limit) |
| 60 to 80 or 20 to 40 | 250 dollars (0.25 percent) | 0.5 lots | 500 dollars (10 percent of the limit) |
| 40 to 60 | 0 dollars — no trend trade | 0 lots | 0 dollars |
Two stopped trades in the strong zone still leave 4,000 dollars of daily room, which means one bad morning cannot end my account. That is not caution for its own sake. Prop-firm maths is unforgiving: a 5 percent daily breach is not a lesson, it is a termination. The grid exists so that a normal losing day and a breach stay a long way apart. For the same reason, I never add to a TII trade that is going against me. Averaging down inside a fading trend is how a 500-dollar risk becomes a 5,000-dollar breach.
I tested it: twelve filtered trades against twelve unfiltered ones
I went back through my own journal and split 24 EURUSD and GBPUSD trend trades into two groups of twelve: trades taken only when daily TII was past 80 or below 20, and trades taken on chart shape alone with no TII check. The difference was not subtle, and it was not in the win rate alone.
| Group | Trades | Winners | Average win | Average loss | Net result |
|---|---|---|---|---|---|
| TII-filtered (past 80 or below 20) | 12 | 7 | plus 820 dollars | minus 460 dollars | plus 3,440 dollars |
| Unfiltered (chart shape only) | 12 | 5 | plus 640 dollars | minus 610 dollars | minus 1,050 dollars |
The filtered group did not win dramatically more often — seven against five — but its winners were bigger and its losers smaller, because strong trends run further and fail faster. The unfiltered group is where my old habit lived: buying dips in trends that looked strong but measured weak, then watching small losses turn into hold-and-hope losses. The filter did not make me a better trader. It stopped me from trading my worst setups, which turns out to be most of the job. If you want the pullback-entry rules I pair with a strong TII reading, my trend pullback guide covers them in full.
Common mistakes, including the ones I still make
The first mistake is trading the 50 cross. TII crossing 50 feels like a signal, and signal-hungry traders take it. It is not a signal, it is a halfway mark, and halfway trends reverse constantly. The second mistake is using TII on a low timeframe and wondering why it whipsaws. A 30-period calculation on a 5-minute chart measures 150 minutes of market noise, not a trend. The third mistake is the one I still catch myself in: keeping a trade open after TII has fallen back through 60, because the trade is in profit and I do not want to admit the trend is tired. A fading TII is not a reason to panic out, but it is a reason to tighten the stop and stop adding.
The fourth mistake is subtler: combining TII with three other trend indicators and calling it confirmation. TII, ADX and a moving-average stack all measure the same thing in different clothes, so their agreement is really one piece of evidence counted three times. I pair TII with one genuinely different input — a support level or a session filter — and that is enough.
My daily routine with the Trend Intensity Index
Every morning before London opens, I check the daily TII on the two pairs I trade and write the number in my journal next to the daily limit. Above 80 or below 20, the pair is on the tradeable list and I plan pullback entries only in the trend’s direction. Between 60 and 80, or 20 and 40, the pair is on half-size watch. Between 40 and 60, the pair is off the list, and I spend that attention elsewhere — or on nothing at all. Some of my best funded-account days were days I traded nothing, because the numbers told me there was nothing worth the risk.
At the end of the day I log the closing TII next to the result, win or lose. Over months, that log turned TII from an indicator I had read about into a rule I actually obey: measure the trend before you spend the daily limit on it. For the wider drawdown picture, my Ulcer Index guide covers the other gauge I check alongside it, the one that measures how painful the ride has already been.
Frequently asked questions
Is the Trend Intensity Index better than ADX for funded traders?
They answer different questions. ADX measures trend strength without direction, on a 0 to 100 scale of its own. TII measures strength with direction built in: above 50 is bullish strength, below 50 is bearish. I prefer TII for the permission decision because one number tells me both whether to trade and which way, but ADX is a fine alternative if your platform ships it and TII is unavailable.
What TII setting should a beginner start with?
The standard 30-period TII against a 60-period simple moving average, on the daily chart. Do not optimise the settings until you have traded the default for at least a month, because changing settings to fit past charts is the fastest way to build an indicator that works beautifully on history and fails on live markets.
Can TII be used for scalping?
Poorly. TII is a trend-strength gauge built from 30 bars against a 60-bar average, so on short timeframes it measures noise, not trend. Scalpers need faster tools. TII earns its place on funded accounts precisely because it is slow: it keeps you out of the chop that scalping systems drown in.
Does a TII above 80 mean I should buy immediately?
No. Above 80 means longs are permitted, not required. I still wait for a pullback to a level, an average, or a support zone, and I still size from the daily limit. Buying at market the moment TII prints 81 is how you buy the top of the move that pushed it there.
Why does my platform not have the Trend Intensity Index built in?
It is a lesser-known indicator from a 2002 magazine article, so most platforms never added it. Community scripts exist for the major platforms, and a spreadsheet from exported closes works just as well. Whatever you use, verify it against the hand calculation in this guide — 312 and 78 must give exactly 80 — before you trust it with real decisions.
What happens when TII stays between 40 and 60 for weeks?
That is a ranging market telling you the truth, and the correct response is to trade less, not to force trend trades. Range tactics, smaller size, or no trades at all are all better than spending a daily limit trying to make a trend exist. Funded accounts are lost in chop far more often than in trends.
Trading involves risk, and prop-firm accounts can be terminated for breaching daily or overall loss limits. The settings and examples in this guide reflect my own journal and risk rules, not financial advice. Always check your firm’s current rules before trading a new indicator or strategy.



