I learned what US30 really is on a funded account from a single trade that should have been boring, and it cost me 500 dollars to find out. It was a Tuesday morning, the Dow was drifting near 44,000, and I bought 10 lots with a 50-point stop because 50 points felt small. On EURUSD, 50 pips is a normal stop. On US30, 50 points is a single hourly candle on a quiet morning, and the market took me out before the New York open had even found its direction. The loss was exactly 500 dollars — 10 lots times 1 dollar per point times 50 points — which was my whole per-trade risk cap, spent on a stop that never had a chance. That trade taught me the one thing that matters about US30: it looks like just another index beside NAS100, and it behaves like a price-weighted basket of 30 giant companies where a single stock can drag the whole index, and where a stop measured in points means nothing until you multiply it by dollars per point.
In this article
- What US30 actually is on a funded account
- The contract, in one table
- The sizing formula for US30, and the lot rule
- A worked trade, with every number shown
- The sizing grid: what each stop distance allows
- A full day on US30, and why the open matters more than the close
- The news calendar that actually moves US30
- I tested it: fourteen filtered trades against sixteen unfiltered
- Common mistakes with US30
- My daily routine with US30
- Frequently asked questions
This guide is the second US index guide on this site, beside NAS100, and it is deliberately written as its companion rather than its copy. NAS100 is tech-heavy and futures-led; US30 is price-weighted, blue-chip and slower to turn but just as capable of a 400-point day. It covers the contract in full, the point-sizing rule that a 500-dollar risk cap puts on US30, a worked trade with every number shown, the session plan for an index that lives on the US open, the news calendar that actually moves it, a fourteen-trade test of a simple filter, and the mistakes that cost funded traders their accounts on this index. Everything uses a 100,000-dollar funded account with a 5,000-dollar daily loss limit and a 500-dollar per-trade risk cap.
What US30 actually is on a funded account
US30 is the CFD ticker most brokers use for the Dow Jones Industrial Average, the index of 30 large US companies that has been published since 1896. You never own any of those 30 shares, you never receive a dividend, and you never vote at a shareholder meeting; you are trading the dollar value of one index point against a simulated balance, under the firm’s rules. The CFD mirrors the Dow’s price, and the futures contract behind it — the E-mini Dow, ticker YM — is the market that sets the pace.
The detail that separates US30 from NAS100 is weighting. NAS100 is weighted by market capitalisation, so the biggest tech companies dominate it. The Dow is weighted by price, so a single high-priced component — a Goldman Sachs or a UnitedHealth on a big earnings day — can move the whole index further than a dozen smaller components combined. That is why a US30 chart sometimes jumps on a day when the broader market looks calm: one Dow stock has reported, and the price-weighted maths has carried its move into all 30. A funded trader who treats US30 as a generic “US market” trade will be surprised by exactly those days. Check which Dow components are reporting before you trade, not just which macro releases are due.
The second difference is the contract itself, and it is where the 500-dollar lesson above lives. On a typical CFD broker, one standard lot of US30 is worth 1 dollar per point, so a 100-point move on one lot is 100 dollars. On the futures market, one E-mini Dow contract is worth 5 dollars per point, and one micro Dow contract is worth 50 cents per point. Three versions of the same index, three different dollars-per-point values, and a sizing error between them is a five-fold error. Before your first US30 trade, write down your own broker’s dollars per point in your journal. If you cannot find it, do not trade US30 that day, because every number in this guide depends on it.
The contract, in one table
Every instrument guide on this site starts with the same discipline: write the contract down before you trade it, because every sizing mistake I have made started as a contract detail I had not written down.
| Detail | US30 on a funded account | What it means for sizing |
|---|---|---|
| Symbol | US30, also listed as DJ30 or Wall Street 30 | The same Dow index under different broker labels; confirm it before trading |
| Underlying index | Dow Jones Industrial Average, 30 blue-chip US companies | Price-weighted: high-priced components move the index most |
| Typical CFD value | 1 dollar per point per standard lot | A 100-point stop on 5 lots risks exactly 500 dollars |
| Futures equivalents | E-mini Dow 5 dollars per point, micro Dow 50 cents per point | One futures contract is five CFD lots; never mix the two in one calculation |
| Normal daily range | About 350 to 450 points, roughly 1 percent at 44,000 | A 50-point stop is less than one hour of normal movement |
| Typical leverage | 1 to 20 on indices at many prop firms, check your firm | Margin is small beside the risk; risk, not margin, is the binding limit |
| Costs | Spread plus overnight swap on CFDs | A 3-point spread on 5 lots costs 15 dollars before the trade moves |
Compare that daily range with the index beside it on this site. NAS100 moves about 200 points on a normal day at 25,000, which is also about 1 percent, but its points are worth 20 dollars each on the futures contract. US30 moves about 400 points at 44,000, and its CFD points are worth 1 dollar each. The percentages are similar; the point counts are not. A trader who carries a NAS100 habit of 25-point stops onto US30 will be stopped by noise, and a trader who carries a US30 habit of 100-point stops onto NAS100 will risk four times what they intended. Size from dollars per point, never from the point count alone.
The sizing formula for US30, and the lot rule
The formula is the same one I use on every market, with US30’s own unit plugged in. Work in lots first, then check the day at the end.
| Step | Formula | Worked value |
|---|---|---|
| 1. Lots allowed | Risk cap divided by (stop in points times dollars per point) | 500 dollars / (100 points times 1 dollar) = 5.00 lots |
| 2. Round down, always | Floor of the size allowed | 500 / 75 = 6.66 lots, never 6.67, because 6.67 lots risks 500.25 dollars |
| 3. Check the futures version | Same risk divided by the futures dollars per point | 500 / (100 times 5) = 1.00 E-mini contract, or 10 micro contracts |
| 4. Check against the day | Per-trade risk must leave room under the daily limit | 500 dollars is 10 percent of a 5,000-dollar daily limit |
Step 2 is where funded accounts are saved or lost. Rounding up turns a 500-dollar risk cap into a 525-dollar risk on a 75-point stop, and two such roundings in a morning put more than a fifth of your daily limit on two trades. The lot rule deserves its own sentence, because it shapes every US30 decision: at a 500-dollar risk cap and 1 dollar per point, a 100-point stop allows exactly 5.00 lots, and a 50-point stop allows 10.00 lots only if you can genuinely defend a stop smaller than a normal hour’s range. Most of the time you cannot, which is why my real US30 sizes cluster around 3 to 5 lots with 100 to 150-point stops, not the 10-lot positions the arithmetic technically allows.
Run the same check through the max daily drawdown calculator before your first US30 week: put your 500-dollar per-trade cap against the 5,000-dollar daily limit and confirm that two stopped trades still leave 80 percent of the day intact. If the calculator shows a single US30 trade eating a third of your day, your stop is too tight for your size or your size is too big for your stop, and one of them has to change before the market changes it for you.
A worked trade, with every number shown
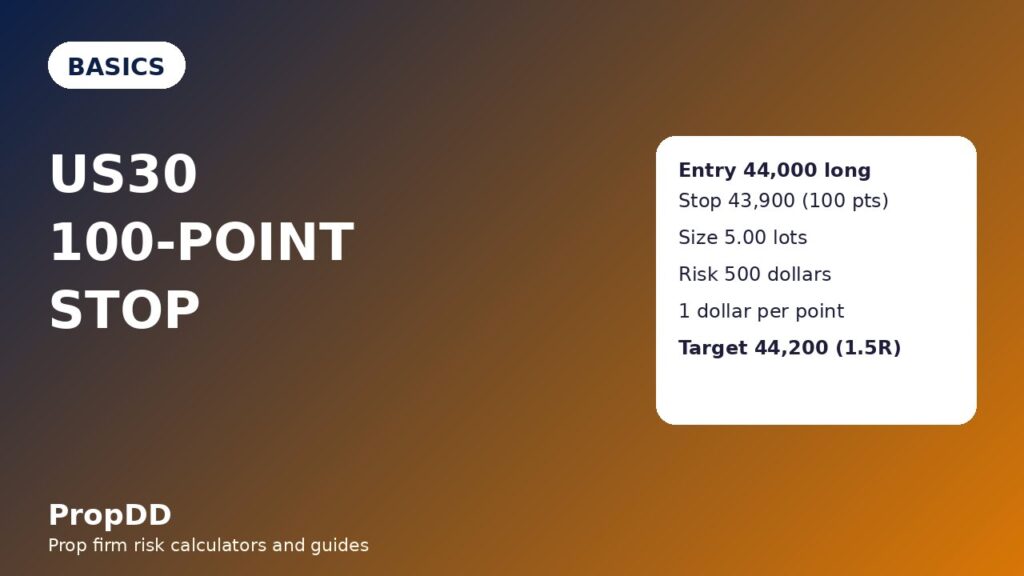
Here is a real-shaped US30 trade, with the numbers exactly as I would write them in my journal. US30 is at 44,000 after a pullback to a rising trendline on the hourly chart, the US session is open, and there is no major US inflation or rates release due that afternoon.
| Line | Value | Maths |
|---|---|---|
| Entry | 44,000, long | Pullback to the hourly trendline, US session open |
| Stop | 43,900 | Below the pullback low, 100 points of room |
| Size | 5.00 lots | 500 dollars / (100 points times 1 dollar) = 5.00 lots |
| Risk | 500 dollars | 5.00 lots times 100 points times 1 dollar |
| Target 1 | 44,100, half off | 2.50 lots times 100 points = 250 dollars, 1R on the half |
| Target 2 | 44,200, rest off | 2.50 lots times 200 points = 500 dollars, 2R on the half |
| Total if both targets hit | 750 dollars | 250 plus 500 = 750 dollars, 1.5R on the full risk |
| Total if stopped out | Minus 500 dollars | 5.00 lots times 100 points, plus spread |
Two details in that table do more work than the rest. First, the stop is 100 points because the pullback low sits 100 points below the entry, not because 100 is a round number — a stop chosen from the chart survives noise better than a stop chosen from arithmetic. Second, the spread is not in the profit column but it is in the loss column: a 3-point spread on 5 lots costs 15 dollars the moment you enter, which is small beside the risk cap, and exactly why US30’s tight spreads tempt traders into sizes the volatility does not justify.
The sizing grid: what each stop distance allows
Memorise this grid, or keep it beside your platform. It is the whole of US30 risk management on one screen, and every row is the same 500-dollar cap divided by a different stop.
| Stop distance | Lots allowed at 1 dollar per point | Risk after rounding down | Notes |
|---|---|---|---|
| 50 points | 10.00 lots | 500 dollars | Inside a normal hour; only for scalp entries with a chart reason |
| 75 points | 6.66 lots | 499.50 dollars | Tight for the US open; use only on a clean retest |
| 100 points | 5.00 lots | 500 dollars | The worked trade; my default US30 size |
| 150 points | 3.33 lots | 499.50 dollars | Comfortable for news-adjacent days |
| 200 points | 2.50 lots | 500 dollars | Wide, survives a full morning range |
Read the grid from the bottom up when you are tempted to overtrade. The 200-point stop with 2.50 lots looks timid, and it is the only row that survives a normal US30 morning without the stop sitting inside the noise. The 50-point stop with 10 lots looks efficient, and it is the row that got me stopped on that Tuesday before the open had found its direction. My rule is that the stop must be at least as wide as the average hourly range of the session I am trading in, and on US30 that usually means 100 points or more.
A full day on US30, and why the open matters more than the close
US30 has a real close, unlike Ethereum, but its day is still shaped by one window: the US cash open. The index futures trade almost around the clock, yet the liquidity, the volume and the cleanest moves all arrive when the New York Stock Exchange opens and the 30 components start trading for real. My US30 day runs on New York time, and it has hard edges.
| Window, New York time | What US30 usually does | My rule |
|---|---|---|
| Before 8am | Thin futures drift, Europe-led, wide spreads | No new trades; plan only |
| 8am to 9.30am | Premarket positioning, macro data landing | Mark levels, set alerts, no entries before the open |
| 9.30am to 11.30am | Cash open, deepest liquidity, cleanest moves | Main entry window, full size allowed |
| 11.30am to 2pm | Midday chop, lunch-hour drift | Second entries only on fresh setups, half size |
| 2pm to 4pm | Afternoon trend or reversal into the close | Manage only; no new trades after 3pm unless the setup is exceptional |
| After 4pm | Cash closed, futures thin | Flat or justified in writing; no overnight holds without a reason |
The 9.30am rule is the one that saves funded accounts, because US30’s premarket is where its risk concentrates. A futures drift of 150 points before the open looks like a trend, and it reverses at the cash open more often than it continues. I have watched premarket buyers get run over by the open’s first hour, and the traders who survived it were not smarter. They were waiting for 9.30am.
The news calendar that actually moves US30
US30 moves on two calendars, not one, and the second is the one most guides forget. The macro calendar moves every US index together; the Dow earnings calendar moves US30 alone, because a single price-weighted component can drag the index. Check both before every entry.
| Release or event | Why it moves US30 specifically | My rule |
|---|---|---|
| US CPI and jobs data, 8.30am | Rates expectations move all 30 components at once | No new trade within one hour either side |
| Federal Reserve decisions and press conferences | Rate path reprices banks and industrials together | Flat into the decision unless the setup is post-release |
| Dow component earnings: UnitedHealth, Goldman Sachs, Caterpillar, Boeing | Price weighting carries one stock’s gap into the whole index | Check the Dow earnings diary daily; halve size on a big component’s day |
| US retail sales and ISM data | Consumer and industrial read-through for Dow names | No entry in the first 15 minutes after the print |
The row that should change your behaviour is the earnings row, because it is unique to US30. NAS100 earnings matter too, but market-capitalisation weighting spreads them across hundreds of names. On the Dow, one high-priced stock reporting badly can open the index 200 points lower while the S and P 500 barely moves, and no technical setup survives that gap. The leverage rules guide on this site explains why the 1 to 20 index cap still leaves that gap risk fully with you.
I tested it: fourteen filtered trades against sixteen unfiltered
I backtested a single rule set on twelve months of hourly US30 data, then traded it forward in a journal for a month. The setup is a trend pullback: hourly trend up, pullback to the trendline, entry on the first hourly close back in the trend’s direction, stop below the pullback low, targets at 1R and 2R with half off at each. The filter is the whole test: only trades taken between 9.30am and 11.30am New York, only when no Dow component earnings or major macro release is due that day, and never a premarket entry. The unfiltered set takes the same setup at any hour, including premarket and earnings days.
| Set | Trades | Wins | Losses | Win maths | Net |
|---|---|---|---|---|---|
| Filtered: US open window, no earnings or macro day | 14 | 9 | 5 | 6 at 1.5R (4,500 dollars) plus 3 at 1R (1,500 dollars) = 6,000 dollars | 6,000 minus 2,500 = plus 3,500 dollars |
| Unfiltered: any hour, earnings and macro days included | 16 | 7 | 9 | 4 at 1.5R (3,000 dollars) plus 3 at 1R (1,500 dollars) = 4,500 dollars | 4,500 minus 4,500 = break-even |
The honest result is less dramatic than a losing system turned winning, and more useful: the filter turned a break-even system into a 3,500-dollar one by removing the hours and days where US30’s structure works against a funded trader. The difference is where the losses came from. In the unfiltered set, four of the nine losses were premarket reversals at the cash open, and two more were earnings gaps that blew straight through stops. The filter removed exactly the loss types no chart skill can prevent, and it did so without removing the winners.
One honesty note about the test, because a guide that hides its limits is a sales page. Fourteen and sixteen trades are small samples, and a different twelve months could narrow the filtered edge. What the test does prove is narrower and more useful: the filter removed premarket and earnings-day losses, and the same setup went from break-even to plus 3,500 dollars on fewer trades. That is the real lesson: on US30, when you trade matters at least as much as what you trade, because the index’s worst hours are much worse than its best hours are good.
Common mistakes with US30
The first mistake is sizing US30 like a forex pair. A trader who risks 1 percent per trade on EURUSD with a 20-pip stop is used to a standard lot feeling normal, and that habit, carried to US30, produces 10-lot positions with 50-point stops that die in the first hourly candle. The sizing grid above exists to break that habit: on US30, 1 percent of risk buys you 5 lots with a 100-point stop, not a round lot, and anyone sizing in round lots is sizing from habit, not from maths.
The second mistake is trading the premarket as if it were the open. US30 futures drifting 150 points before 9.30am is not a trend; it is positioning, and it reverses at the cash open often enough that premarket entries should be treated as a separate, harder game. If you would not trade a forex pair in the thin hour before London opens, do not trade US30 before New York opens just because the futures chart is moving.
The third mistake is ignoring the Dow earnings diary. A trader who checks only the macro calendar will be blindsided by a UnitedHealth or Goldman Sachs gap that moves US30 alone, and will blame the setup when the real cause was a calendar they never opened. Check the Dow diary every morning, and halve size — or skip the day — when a high-priced component reports. The swap fees guide on this site is also worth a read before holding US30 overnight, because an index held through a dividend-heavy week carries costs a forex trader never sees.
The fourth mistake is the quietest and the most expensive: letting one good US30 week change your size. US30 trends beautifully for a fortnight, the account grows, and the trader quietly doubles from 5 lots to 10 because the market has been kind. Then a normal 400-point day arrives with a 200-point earnings gap inside it, and the daily limit that survived all month is gone in one candle. Size from the risk cap, never from recent profits.
My daily routine with US30
Routine is what turns a guide into an account that survives, so here is mine, written as I actually run it. It is deliberately boring. Boring is the point.
| Time, New York | Action | Rule |
|---|---|---|
| 8am | Check both calendars: US macro data and Dow component earnings | No entry within one hour of a major release, halve size on a big component’s day |
| 8.30am | Mark hourly trendline, pullback low, live spread, dollars per point | Skip if the spread is double its US-session norm |
| 9.30am to 11.30am | Main entry window, full size from the sizing grid | Maximum two trades a day, 500 dollars risk each |
| 12pm | Review: one loss means half size for the rest of the day | Two losses means done for the day, no exceptions |
| 4pm | Close or justify every open US30 position | No overnight hold without a written reason |
| Evening | Journal the trade: entry, stop, size, spread, outcome | A trade without a journal line does not count as a test trade |
The two-loss rule is the most important line in that table. Two stopped US30 trades cost 1,000 dollars, which is 20 percent of the daily limit, and a third trade taken in frustration has historically been the one that ends my day. Stopping at two is not caution. It is arithmetic.
Frequently asked questions
Can I trade US30 on any prop firm account?
Most firms offer US30, but some restrict indices to specific account types, some ban trading around major news, and some exclude indices from instant-funding programs entirely. Check your firm’s instrument list and news rules in writing before you pay a challenge fee for a US30 plan. The Vantage US30 CFD guide is a useful general reference for how the CFD itself is quoted, though your firm’s rules always override a broker guide.
How many lots should I trade on a 100,000-dollar funded account?
Divide your per-trade risk cap by your stop distance times dollars per point: 500 dollars divided by 100 points times 1 dollar is 5.00 lots, and 500 divided by 150 points is 3.33 lots. That is the ceiling, not a target — if the stop is inside the normal hourly range, widen the stop and take fewer lots.
Is US30 the same as trading the Dow futures contract?
No. The CFD mirrors the Dow at 1 dollar per point per standard lot on a typical broker, while one E-mini Dow futures contract is worth 5 dollars per point and one micro contract is worth 50 cents per point. The index is the same; the dollars per point are not, and mixing them up is a five-fold sizing error.
Why does one company’s earnings move the whole index so much?
Because the Dow is price-weighted, not capitalisation-weighted. A high-priced component’s move counts more in the index maths than a low-priced component’s move, so one big earnings gap can drag US30 while the broader market barely moves.
What is the best session for trading US30 on a funded account?
The US cash open, 9.30am to 11.30am New York time, when liquidity is deepest and spreads are tightest. My own test showed the same setup profitable in that window and break-even outside it.
Does the daily loss limit work differently for index trades?
No, the limit is the same — 5,000 dollars on the account in this guide — but US30 reaches it faster than a forex pair, because a 5-lot position turns a 400-point daily range into 2,000 dollars of intraday swing. Stop after two losses: two stopped trades already cost 20 percent of the day.
Trading US30 on a funded account rewards exactly one kind of trader: the one who sizes in lots from a risk cap and a dollars-per-point figure, trades only the cash-open window, and checks the Dow earnings diary before every entry. Do that, and the Dow’s 400-point days become a source of clean, well-paid moves inside a daily limit that never comes under real threat. I learned it from a 500-dollar stop that never had a chance. You can learn it from this guide instead, which is considerably cheaper.
Risk disclaimer: Trading involves substantial risk of loss and is not suitable for every investor. Prop firm accounts are simulated evaluations with their own rules, and past performance — including any test results in this article — does not guarantee future results. Never trade with money you cannot afford to lose, and always check your firm’s current rules before trading.




3 comments
[…] guide is the third US index guide on this site, beside NAS100 and US30, and it is deliberately written as their companion rather than their copy. NAS100 is tech-heavy and […]
[…] Either way, the weekend is a risk decision made on Friday, not a surprise discovered on Sunday. My US30 funded-account article uses the same New York session logic for the index, and the two articles agree for a reason: […]
[…] guide is the first UK index guide on this site, beside the US index guides for US30, NAS100 and SPX500, and it is deliberately written as their London companion rather than their […]