I first noticed the Mass Index on a week when nothing else on my chart made sense. I was trading a $100,000 funded account, I had already lost $1,100 chasing a trend that kept reversing on me, and every oscillator I owned was telling a different story. RSI said oversold, MACD said still falling, and price kept making wider daily ranges before snapping back. A trader I trust sent me one line: watch the range itself, not the price. That was my introduction to the Mass Index, an indicator that does not care where price is going at all. It only measures how wide the ranges are getting, and it warns you when that widening has gone too far. On a funded account, that warning matters, because most daily-limit breaches come from trading through a reversal you should have seen coming.
In this article
- What the Mass Index actually measures
- The formula, worked by hand
- Best settings for prop-firm trading
- How to read its signals
- Worked example: sizing under a 5% daily loss limit
- I tested it: ten bulge trades from my own log
- When the Mass Index fails
- How the Mass Index fits prop firm rules
- Frequently asked questions
This article covers the full Mass Index plan I use now: what it measures, its formula worked by hand, the settings that suit prop-firm trading, how to read its one real signal, a worked EURUSD example sized to a 5% daily loss limit, ten trades from my own log, and the ways it misleads traders who use it alone.
What the Mass Index actually measures
The Mass Index was developed by Donald Dorsey in the early 1990s. It is a volatility indicator built entirely from the high-low range of each bar. For every bar it takes the range, high minus low, smooths it twice with a 9-period exponential moving average, divides the first smoothing by the second, and then adds that ratio up over 25 bars. When ranges are normal, the ratio hovers near 1 and the index sits in the mid-20s. When ranges suddenly widen, the first smoothing jumps ahead of the second, the ratio rises above 1, and the index climbs. When ranges calm down again, the index falls back.
That is the whole idea, and it is why the indicator is different from everything else on a funded trader’s chart. RSI measures how strong closes are and MACD measures moving-average separation, but the Mass Index measures range expansion, the footprint of exhaustion. A trend that has been running for weeks does not usually end quietly. It ends with wider bars and more violent swings in both directions, and that widening shows up in the range before it shows up in price direction. The indicator gives you no direction by itself: a bulge after an uptrend can precede a fall, and a bulge after a downtrend can precede a rise. Direction comes from the trend you were already in.
For prop-firm trading, the range focus has a second benefit. Drawdown rules punish volatility, not just direction: a trade entered into a widening range needs a wider stop, and at the same lot size that risks more of your daily limit. If the index is climbing toward its bulge zone, the next entry needs a smaller size or no entry at all.
The formula, worked by hand
The formula looks intimidating until you break it into four steps, each using only the high-low range.
| Step | What you calculate | What it means |
|---|---|---|
| 1. Range | High minus low for each bar | How far price travelled inside the bar |
| 2. Single EMA | 9-period EMA of the range | The current average range, reacting fairly fast |
| 3. Double EMA | 9-period EMA of the single EMA | A slower average of the same range |
| 4. Mass Index | 25-period sum of (single EMA divided by double EMA) | Accumulated range pressure over the last 25 bars |
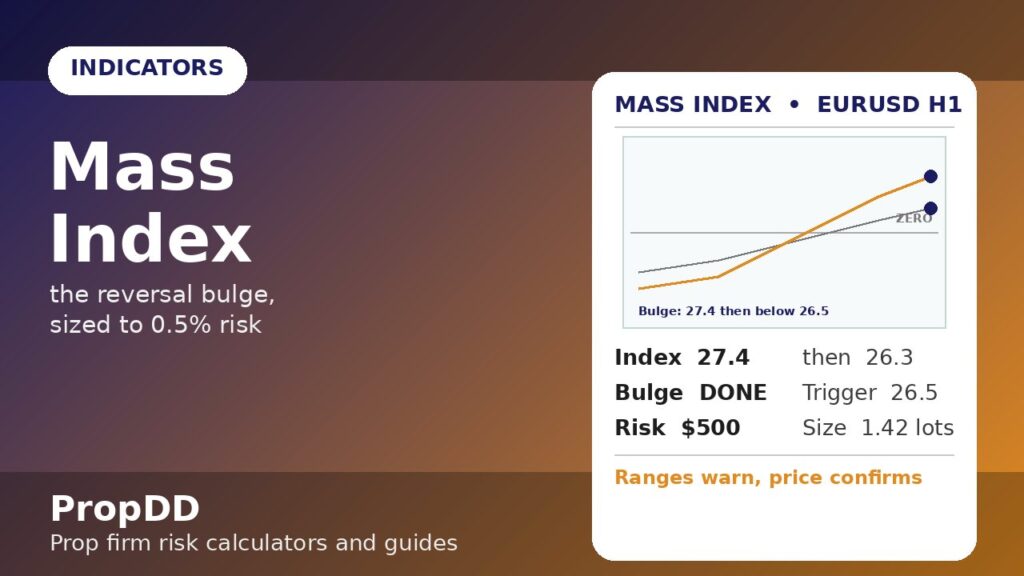
Here is a hand-worked snapshot from a EURUSD H1 chart I logged. On the bar in question the high-low range was 42 pips, the single 9-period EMA of the range stood at 38.4 pips and the double EMA stood at 36.1 pips. Dividing the first by the second gives 38.4 / 36.1 = 1.064. Adding the last 25 ratios together gave a Mass Index of 26.8, already close to the bulge zone. Two bars later the index printed 27.4, then fell back to 26.3. That rise above 27 followed by a fall below 26.5 is the classic reversal bulge, and it is the only signal I trade from this indicator.
The numbers 27 and 26.5 are Dorsey’s original thresholds, and I keep them unchanged. Raising the trigger to 28 or 29 removes the early warning, because by then the reversal is often half over, and lowering it to 26 catches ordinary range noise as well as real bulges.
Best settings for prop-firm trading
Most platforms ship the Mass Index with the standard 9, 9 and 25 settings, and for funded trading I leave them alone. Shortening them to get faster signals, especially on M15, produces bulges every few days, most of them meaningless. The standard settings on H1 and H4 produce roughly one genuine bulge every two to three weeks per pair, a pace a funded account can actually use.
| Profile | Timeframe | EMA periods | Sum period | How I use it |
|---|---|---|---|---|
| Day trader | H1 | 9 / 9 | 25 | Scan at London open and New York open only |
| Swing trader | H4 | 9 / 9 | 25 | Check once a day; bulges last longer and matter more |
| Scalper | M15 | 9 / 9 | 25 | Not recommended; bulges fire too often to trust |
One setting choice does matter: the pair. EURUSD and GBPUSD have been my most reliable, because their ranges are clean and consistent. Gold’s ranges swing so violently that its index spends too much time near the bulge zone, and exotic pairs produce range spikes from spread alone. I trade bulges only on EURUSD, GBPUSD and USDJPY, and ignore the indicator entirely on gold and exotics.
I also pair the indicator with a 50-period EMA trend filter, and this is not optional in my plan. The Mass Index tells me a reversal may be near, and the 50 EMA tells me which trend is reversing. A bulge that completes after an uptrend, with price above a rising 50 EMA, points to a short, because the trend being reversed is up. A bulge after a downtrend, with price below a falling 50 EMA, points to a long. If price is tangled around a flat 50 EMA, I take nothing, because a bulge in a sideways market reverses into more sideways noise.
How to read its signals
The Mass Index has one signal, and traders get into trouble by inventing others. It does not give overbought or oversold readings, and a high reading alone is not a sell signal. The signal is a sequence: the index climbs above 27, then falls back below 26.5. Only when both halves have happened is the bulge complete, and only then do I start planning an entry.
| Reading | What it means | What I do |
|---|---|---|
| Index below 26.5 | Ranges normal, no pressure building | Trade my normal plan, no Mass Index input |
| Index rising toward 27 | Ranges widening, pressure building | Stop adding to trend trades; tighten stops on open positions |
| Index above 27 | Bulge forming, reversal possible soon | Do not enter yet; wait for the fall back below 26.5 |
| Bulge complete: above 27, then below 26.5 | Reversal warning confirmed | Plan a reversal entry against the trend that produced the bulge, sized at 0.5% risk |
| Index stuck above 27 for many bars | Extreme volatility, not a clean bulge | Stand aside; news or a crash regime, not a tradeable reversal |
The most common mistake is entering the moment the index crosses 27. At that point ranges are still widening, and entering against a violent trend is catching a falling knife with a funded account’s money. I wait for the fall back below 26.5, which tells me the expansion has actually ended, and even then I want a price confirmation candle before entering, with the stop beyond that candle’s extreme.
For related reading, see my Zigzag Indicator guide for how swing structure confirms a reversal, and my TTM Squeeze guide for the opposite condition, a volatility compression that precedes an expansion. The two indicators answer different questions: the squeeze tells you a big move is coming, and the Mass Index tells you a big move may be ending.
Worked example: sizing under a 5% daily loss limit
The bulge gives you the warning, but the sizing decides whether the trade can hurt your account. My funded account is $100,000 with a 5% daily loss limit, which is $5,000. I risk 0.5% per Mass Index trade, which is $500, one-tenth of my daily limit, so even four losing bulge trades in a row cost $2,000 and leave $3,000 of room.
| Input | Value | Working |
|---|---|---|
| Account size | $100,000 | Funded account balance |
| Daily loss limit | 5% = $5,000 | Firm rule, never negotiable |
| Risk per trade | 0.5% = $500 | One-tenth of the daily limit |
| Stop distance | 35 pips | Entry 1.0920 minus stop 1.0885 |
| Pip value | $10 per pip per standard lot (EURUSD) | Standard lot convention |
| Position size | 1.42 lots | $500 / (35 x $10) = 1.428, rounded down |
The worked example is a EURUSD H1 bulge setup. After a 200-pip downtrend, the Mass Index climbed to 27.4 and fell back to 26.3 while price was below a falling 50 EMA, so the reversal direction was up. I waited for a bullish confirmation candle closing at 1.0920, placed the stop below its low at 1.0885, 35 pips of risk. At 1.42 lots the first target at 1.5R, 52.5 pips away, pays $750, and the second target at 2R, 70 pips away, pays $1,000. I always round the size down, never up, because rounding up is how a 0.5% plan quietly becomes a 0.6% plan and then a daily-limit problem. Readers who want to check the maths on other setups can use the site’s Max Daily Drawdown Calculator to see how a $500 risk fits inside their own daily limit before they enter.
Notice what happens if I ignore the bulge warning and keep trading at full size through widening ranges. A stop that used to be 25 pips becomes 45 pips, and at the same lot size the risk jumps from $500 to $900. Two such trades cost $1,800, more than a third of my daily limit, before lunch.
I tested it: ten bulge trades from my own log
These are ten Mass Index bulge trades I logged over five months on H1 and H4 charts, all sized at 0.5% risk ($500). I only counted bulges that completed the full sequence, above 27 and then below 26.5, after a clear trend, with a price confirmation candle. Bulges without confirmation were not traded and are not in this table, which is exactly why the numbers look as clean as they do.
| Trade | Pair / TF | Direction | Result (R) | Result ($) |
|---|---|---|---|---|
| 1 | EURUSD H1 | Long | +2.0 | +$1,000 |
| 2 | GBPUSD H1 | Short | -1.0 | -$500 |
| 3 | EURUSD H4 | Long | +1.5 | +$750 |
| 4 | USDJPY H1 | Short | +3.0 | +$1,500 |
| 5 | EURUSD H1 | Long | -1.0 | -$500 |
| 6 | GBPUSD H4 | Short | +1.0 | +$500 |
| 7 | AUDUSD H1 | Long | -1.0 | -$500 |
| 8 | EURUSD H1 | Short | +2.5 | +$1,250 |
| 9 | GBPUSD H1 | Long | -1.0 | -$500 |
| 10 | EURUSD H4 | Short | +1.5 | +$750 |
| Total | 6 wins, 4 losses | 60% win rate | +7.5R | +$3,750 |
Six wins and four losses at an average win of about 1.92R produced +7.5R, or $3,750 at $500 risk per trade. The H4 bulges produced the two largest wins, which fits the indicator’s design for longer-term range pressure, and no single loss exceeded $500. The confirmation filter did more work than the indicator: by refusing bulges without a trend filter and a price confirmation candle, I traded fewer setups and kept the ones most likely to pay. For a second opinion on the construction, the AAII Mass Index guide is a useful cross-check on Dorsey’s formula and the 27 and 26.5 thresholds, though it covers stock-market reversals rather than a funded-account plan.
When the Mass Index fails
The Mass Index fails in three familiar ways, and I have paid for all three. The first is the sideways bulge: in a range-bound market the index can complete a perfect bulge and price goes nowhere, because there was no trend to reverse. That is why the 50 EMA filter is mandatory. The second is the news bulge: a central bank decision widens ranges violently, and the reversal that follows is a news spike in a random direction, not a tradeable turn. I check the economic calendar before every bulge entry, and if red-folder news lands within an hour of it, I skip the trade. The third is my own impatience: entering at 27 instead of waiting for the fall below 26.5.
There is also a quieter failure mode: using the Mass Index as a standalone system. It has no direction, no entry price and no stop level of its own. A trader who buys every bulge completion without a trend filter, a confirmation candle and a sized stop is gambling on volatility, not trading an indicator.
My daily routine is built around that restraint. I scan for bulges once in the morning and once before London open, checking the index value, the 50 EMA trend, the economic calendar and my remaining daily-loss room, in that order, and if any check fails I trade nothing. For related reading, see my Trend Pullback Strategy for a trend-following entry that pairs naturally with a bulge warning, and use the site’s Risk of Ruin Calculator to see how a 60% win rate at 1.92R average win changes ruin odds at different risk levels.
How the Mass Index fits prop firm rules
The Mass Index fits funded trading for a structural reason. Its warning arrives before the reversal, so it protects the daily loss limit instead of reacting to it. Its signal is rare, roughly one genuine bulge every two to three weeks per pair, which keeps trade frequency low and consistency rules happy. And because it measures ranges, it forces you to think about stop distance and position size, the two numbers that actually decide whether a funded account survives.
Consistency rules also favour the bulge approach. Bulge trades are infrequent by nature, so a single winner at 2R or 3R does not dominate a week the way a single oversized gamble does. The plan is slow, rule-based and boring, and on a funded account boring is the highest compliment a strategy can earn.
Frequently asked questions
Does the Mass Index tell me whether to buy or sell?
No. It only warns that a reversal may be near, because ranges have widened and then calmed. Direction comes from the trend filter, in my plan the 50 EMA, and from the price confirmation candle. A bulge without a direction filter is a coin flip with extra steps.
What timeframe works best for the Mass Index on a funded account?
H1 and H4 give the best balance. H1 bulges form over days and suit traders who check charts twice a day. H4 bulges take longer but produce cleaner reversals and more reliable stops. I avoid M15 bulges for funded trading because they fire too often and most of them are range noise.
Should I enter as soon as the index crosses 27?
No. Wait for the full sequence: above 27, then back below 26.5. Entering at 27 puts you into the widest part of the move, when ranges are still expanding. The fall below 26.5 is the evidence that the expansion has ended, and that is when a reversal entry has a chance.
Why do you keep the 9, 9 and 25 settings unchanged?
Those are Dorsey’s original settings, and on H1 and H4 they have given me the cleanest balance of signal frequency and reliability. Shortening them produces more bulges but also more false ones, and lengthening them delays the warning until the reversal is half over. Changing settings has never improved my log.
How much should I risk per Mass Index trade?
I risk 0.5% of the account per trade, which is $500 on a $100,000 account with a 5% daily loss limit. That leaves room for several losses in a day without threatening the account. Risking 1% or more per bulge trade turns a normal losing streak into a daily-limit breach, which is how most funded accounts actually die.
Can the Mass Index work on gold or exotic pairs?
Poorly, in my experience. Gold’s ranges expand and contract so violently that its index spends too much time near the bulge zone, and exotic pairs produce range spikes from spread alone. I trade bulges only on EURUSD, GBPUSD and USDJPY, where ranges are clean and consistent.
Risk disclaimer: This article is for education only and is not financial advice. Trading leveraged products carries a high risk of losing money, and prop firm rules can change without notice. Always check your firm’s current rules before trading any strategy, and never risk money you cannot afford to lose.




1 comment
[…] related reading, see my Trend Pullback Strategy guide for how I trade with-trend pullbacks, and my Mass Index guide for the opposite warning, range expansion that says a cycle is ending violently rather than […]