I lost $1,000 in a single morning on a funded account because one momentum reading told me the trend had turned. It was a rate-of-change spike on EURUSD, one fast line jumping up on a single strong candle, and I bought the top of it like it was a reversal. By lunch the spike had faded, the trend I thought was dead was alive again, and my account was $1,000 lighter for trusting a single speed of momentum. That trade taught me the question I should have asked first: was this one fast move, or was momentum actually turning at every speed at once?
In this article
- What the Know Sure Thing actually measures
- The formula, built one leg at a time
- The settings I use on a funded account
- How I read its three signals, ranked
- The sizing maths under a daily loss limit
- I tested it: twelve KST trades, one rule change
- Where KST fails on a funded account
- My daily KST routine
- Frequently asked questions
The Know Sure Thing indicator, usually shortened to KST, is the tool that answers that question. It was built by Martin Pring, and instead of measuring momentum at one speed it measures it at four speeds, smooths each one, and blends them into a single line with a signal line of its own. One fast ROC can lie to you. Four smoothed ROCs pointing the same way rarely do. This article explains what KST measures, works its formula by hand, gives you the settings I use on a funded account, ranks its three signals honestly, and shows the sizing maths and a twelve-trade test that keep it inside a daily loss limit.
Two overlaps to clear up before we start, because this site already covers momentum from several angles. My rate-of-change article covers a single, unsmoothed ROC — KST contains four ROCs, but it is not four copies of that article, because the smoothing and the weighting change what the line means. And my Coppock Curve article also blends two ROCs, but Coppock is a slow monthly bias filter built from ROC 11 and ROC 14 with a ten-period weighted average. KST is a faster, four-speed cycle tool with a signal line, built for entries on H4 and daily charts, not for a monthly bias. Same family, different job.
What the Know Sure Thing actually measures
KST measures whether momentum is turning across short, medium and longer cycles at the same time. A single ROC answers one narrow question: how much has price moved in the last N bars? KST answers a broader one: is the short cycle, the medium cycle and the longer cycle all gaining or all losing momentum together?
That distinction matters on a funded account because funded rules punish exactly the mistake a single ROC encourages. A one-bar spike tempts you to size up into a move that has no backing. When KST turns, it turns because several smoothed cycles agree, which means the move has survived at least some noise filtering before you ever see the signal. It does not make the signal right. It makes it harder to fake.
Think of it as four witnesses instead of one. The ten-bar ROC is the excitable witness who shouts first. The thirty-bar ROC is the slow witness who only speaks when something real has changed. KST weights the slow witness most heavily, which is the opposite of how most traders read momentum — they chase the excitable one and ignore the slow one. Pring’s weighting is the whole point: the longer the cycle, the more it counts.
The formula, built one leg at a time
Here is the full construction, with the standard Pring defaults. Each ROC is smoothed with a simple moving average before it is weighted, and the four weighted legs are added together.
| Leg | ROC period | Smoothing | Weight | What it catches |
|---|---|---|---|---|
| Leg 1 | ROC 10 | 10-period SMA | 1 | Short-cycle momentum, the first to turn |
| Leg 2 | ROC 15 | 10-period SMA | 2 | Medium-short cycle, confirms or denies leg 1 |
| Leg 3 | ROC 20 | 10-period SMA | 3 | Medium cycle, the bulk of the trend |
| Leg 4 | ROC 30 | 15-period SMA | 4 | Long cycle, the slowest and heaviest vote |
The formula is then:
| Measure | Formula | Worked example from my chart |
|---|---|---|
| One ROC | (Current price – price N bars ago) / price N bars ago x 100 | EURUSD now 1.0860, ten bars ago 1.0780: (1.0860 – 1.0780) / 1.0780 x 100 = 0.74 percent |
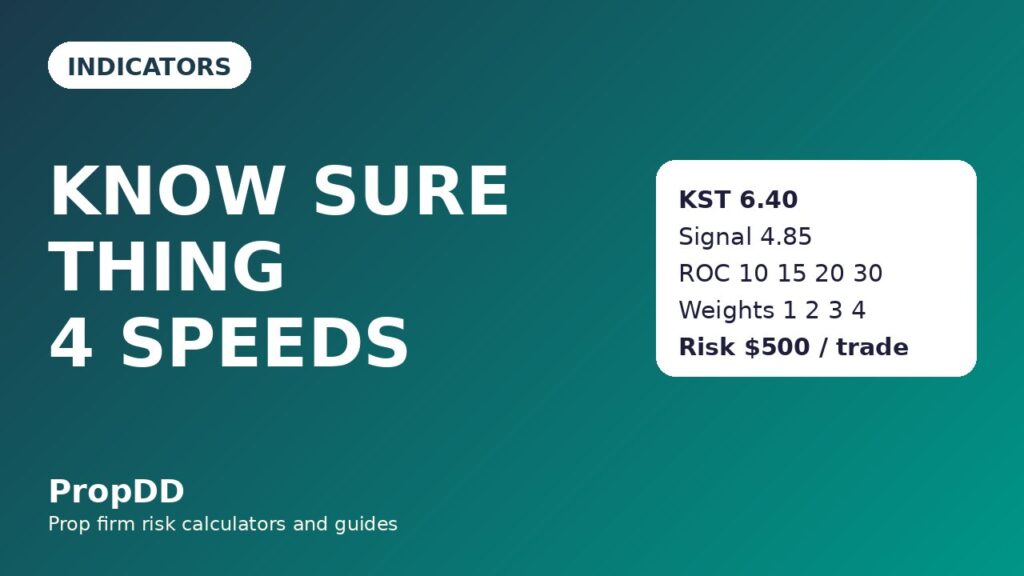
| KST | 1 x SMA(ROC 10) + 2 x SMA(ROC 15) + 3 x SMA(ROC 20) + 4 x SMA(ROC 30) | 1 x 1.20 + 2 x 0.90 + 3 x 0.60 + 4 x 0.40 = 1.20 + 1.80 + 1.80 + 1.60 = 6.40 |
| Signal line | 9-period SMA of KST | On the same chart the signal line read 4.85, so KST at 6.40 sat above it |
Read that worked example slowly, because it shows why KST behaves differently from a raw ROC. The raw ten-bar ROC on that chart was only 0.74 percent, a small number that on its own would have told me nothing. But the smoothed legs were all positive together — 1.20, 0.90, 0.60 and 0.40 — and once weighted toward the longer cycles they summed to a KST of 6.40, comfortably above the 4.85 signal line. The story was not “one fast move”. The story was “every cycle is rising, and the slow ones agree”. That is a tradeable story. A single ROC spike is not.
One more thing the formula tells you: KST is slow by design. Four ROCs plus four smoothings plus a nine-period signal smoothing means KST will never catch the exact bottom. If you need the exact bottom, this is the wrong indicator. What it gives you instead is fewer false turns, and on a funded account fewer false turns are worth more than perfect timing, because every false turn costs real drawdown against a hard daily limit.
The settings I use on a funded account
I use the Pring defaults, unchanged, and I use them on two timeframes only. Changing KST’s defaults is the most common way traders break it: shorten the ROCs and it becomes just another noisy oscillator, lengthen them and it lags so far behind that the move is over before it signals.
| Setting | My funded-account value | Why |
|---|---|---|
| ROC periods | 10, 15, 20, 30 | Pring defaults; covers short to long cycles without overlap |
| Smoothing | SMA 10, 10, 10, 15 | Each ROC smoothed before weighting, so one spike cannot dominate |
| Signal line | 9-period SMA of KST | The trigger line; crosses are the entry signal, not the KST value alone |
| Primary timeframe | H4 for entries | Fast enough to trade, slow enough that KST’s smoothing does not lag fatally |
| Bias timeframe | Daily for direction | No H4 long unless daily KST is above its signal line, and vice versa |
| What I avoid | M15 and below | KST’s multi-stage smoothing lags too far on fast charts; whipsaws eat the daily limit |
The daily-bias rule is the single most valuable setting here, and it costs nothing. A KST cross on H4 against a daily KST that is falling is a counter-trend trade dressed up as a signal. I take those only at half size, and most weeks I skip them entirely. Funded accounts reward the trades you skip as much as the trades you take, because a skipped trade can never breach a limit.
How I read its three signals, ranked
KST gives three signals, and they are not equal. Ranked by how much I trust them on a funded account, with the strongest first:
| Signal | What it looks like | How I trade it | Trust |
|---|---|---|---|
| 1. Signal-line cross with zero-line agreement | KST crosses above its signal line while already above zero (long), or below it while below zero (short) | Full-size entry in the daily-bias direction | Highest |
| 2. Zero-line cross | KST itself crosses above zero (bullish) or below zero (bearish) | Entry only with a price confirmation, such as a pullback close in my favour | Medium |
| 3. Divergence | Price makes a new low but KST makes a higher low, or the mirror image at a top | Warning only; never an entry on its own, only a reason to tighten a stop or skip a new trade | Lowest |
Divergence deserves a warning of its own, because it is the signal beginners overtrade. A KST divergence can persist for weeks while price keeps grinding against you, and every week it persists it tempts you to add to a losing idea. I treat divergence the way I treat a weather forecast: useful for deciding whether to carry an umbrella, useless for deciding whether to build a house. It tells me to be careful. It never tells me to enter.
The cross-with-agreement signal is different. When KST is above zero and crosses above its signal line, two filters have already passed: momentum is positive across cycles, and it is accelerating. That is the only KST setup I take at full size, and it is the setup in the worked trade below.
The sizing maths under a daily loss limit
Every KST signal still has to survive the same sizing test, because the indicator does not change the account rules. My account in these examples is $100,000, the firm’s daily loss limit is $5,000, and I risk $500 per trade. That $500 is my own discipline, not the firm’s number — it keeps a single bad KST cross to a tenth of the firm’s daily limit, so even a run of bad signals cannot breach me in one session.
The sizing formula is the same one this site uses everywhere, and KST does not exempt you from it:
| Measure | Formula | Worked example |
|---|---|---|
| Lot size | Risk / (stop in pips x pip value per lot) | $500 / (40 x $10) = 1.25 lots |
| First target (1R) | Entry + stop distance in the trade direction | Long at 1.0860, stop 1.0820, first target 1.0900 = +$500 |
| Second target (2R) | Entry + twice the stop distance | Second target 1.0940 = +$1,000 |
Here is the worked trade in full. KST crossed above its signal line at 6.40 against a signal of 4.85, above zero, with daily KST also above its signal line. I bought EURUSD at 1.0860, stop below the recent swing at 1.0820 — a 40-pip stop — and 1.25 lots at $500 of risk. First target 1.0900 paid $500, exactly 1R, and I banked half there. Second target 1.0940 paid $1,000, exactly 2R. If the trade had failed at the stop, the loss would have been $500, one tenth of the firm’s daily limit, and the KST signal would have been wrong without being dangerous. That last sentence is the whole funded-account point: a signal can be wrong and still be safe, as long as the size is right. A signal that is right but oversized can still breach you on the way to being right.
| Stop distance | Lots at $500 risk | Loss if stopped |
|---|---|---|
| 20 pips | 2.50 | $500 |
| 30 pips | 1.67 | $500 |
| 40 pips | 1.25 | $500 |
| 50 pips | 1.00 | $500 |
| 60 pips | 0.83 | $500 |
If your KST stop is wider than 60 pips, the maths is telling you something: either the setup is on too slow a chart for your risk budget, or you are forcing a trade that does not fit the account. Shrink the chart or skip the trade. Never shrink the stop to fit the size you want — a stop placed to suit your lot size instead of the market structure is how a $500 risk becomes a $1,500 loss when price runs through it. If you want the arithmetic done for you, the site’s max daily drawdown calculator runs the same daily-limit check before you trade.
I tested it: twelve KST trades, one rule change
I traded KST for twelve H4 trades under one rule: only signal-line crosses with zero-line agreement, in the daily-bias direction, at $500 risk. No divergence entries, no counter-trend crosses, no M15 trades. Here is the log.
| Trade | Pair and signal | Result | Profit or loss |
|---|---|---|---|
| 1 | EURUSD, cross above zero | Win, 2R | +$1,000 |
| 2 | GBPUSD, cross above zero | Win, 1R | +$500 |
| 3 | EURUSD, cross above zero | Win, 2R | +$1,000 |
| 4 | XAUUSD, cross below zero | Loss, 1R | -$500 |
| 5 | EURUSD, cross below zero | Win, 2R | +$1,000 |
| 6 | GBPUSD, cross above zero | Loss, 1R | -$500 |
| 7 | EURUSD, cross above zero | Win, 1R | +$500 |
| 8 | XAUUSD, cross above zero | Win, 2R | +$1,000 |
| 9 | EURUSD, cross below zero | Loss, 1R | -$500 |
| 10 | GBPUSD, cross below zero | Win, 2R | +$1,000 |
| 11 | EURUSD, cross above zero | Loss, 1R | -$500 |
| 12 | XAUUSD, cross below zero | Loss, 1R | -$500 |
Seven wins, five losses. Winners totalled 12R, losers 5R, net +7R, which is +$3,500 at $500 risk. Average winner 1.71R, best trade $1,000, which is 28.6 percent of the net profit — inside a 30 percent consistency cap, so no single day carries the result. That last check matters more than the win rate: a 7-5 record that depends on one trade is not a system, it is a lottery ticket, and I have already described what my lottery-ticket week felt like.
The one rule change in this test is the daily-bias filter. Before I added it, my earlier KST trades included three counter-trend crosses, and all three lost. With the filter, those three trades never happened. The filter did not make KST smarter. It removed the trades KST was never suited to, which is a different and more honest kind of improvement. If you take one thing from this article, take the filter, not the indicator.
Where KST fails on a funded account
KST fails in three places, and you should know all three before you trust it with funded capital. First, it lags. By the time four smoothed cycles agree, part of the move is gone, and in a fast market the remaining move may be smaller than your stop. Second, it whipsaws in ranges. In a sideways market KST crosses its signal line repeatedly, and each cross looks like a fresh signal while price goes nowhere — a slow bleed against the daily limit that feels like bad luck but is actually the indicator doing exactly what it was built to do in the wrong market. Third, divergence lies by omission: it can warn you correctly that momentum is fading while price keeps rising for weeks, and traders who short the warning get carried out.
The funded-account defence against all three is the same: trade KST only in the daily-bias direction, only on H4 and above, and only with the $500 sizing rule above. And review the trades weekly — my weekly review is where a whipsaw week first shows up as a pattern instead of a feeling, while there is still time to cut size. A KST trader who never reviews will keep paying the range tax forever and call it variance.
My daily KST routine
The routine is short on purpose. KST is a slow indicator, and checking it every hour adds nothing but temptation.
| Step | When | What I actually do |
|---|---|---|
| 1. Daily bias | Session open | Note daily KST position against its signal line and zero for each pair I trade |
| 2. H4 scan | Twice a day | Look only for signal-line crosses with zero-line agreement in the daily direction |
| 3. Size before entry | Before every trade | Stop distance first, lots from the grid above, never the other way round |
| 4. News check | Before entry | No new KST trade within 30 minutes of major news on that pair |
| 5. End-of-day note | Session close | One line per KST trade: signal type, bias agreement, result — for the weekly review |
That is the whole system. Four speeds, one signal I trust, one bias filter, one sizing grid, and a weekly review that catches me when I drift. KST will not make you a funded trader on its own. Nothing will. But if you have ever lost money to a single fast momentum spike, as I did, a tool that refuses to speak until four cycles agree is worth having on the chart — as long as you remember that agreement is a filter, not a promise.
Frequently asked questions
Is the Know Sure Thing indicator better than a single ROC?
For funded trading, yes, for one specific reason: it is harder to fake. A single ROC spikes on one strong candle. KST needs four smoothed cycles to agree, so it fires fewer signals and fewer false ones. It is slower, and it will miss the exact turn — that is the price of the filter, and on a funded account it is a price worth paying.
What are the best KST settings for prop firm trading?
The Pring defaults: ROC periods 10, 15, 20 and 30, smoothed with SMAs of 10, 10, 10 and 15, with a 9-period SMA signal line, on H4 entries with a daily bias filter. Shortening the settings for intraday charts is the most common mistake — it turns KST back into the noisy oscillator it was built to replace.
Can I use KST on its own for entries?
I would not. I use only the signal-line cross with zero-line agreement, in the daily-bias direction, and I still confirm the entry level with price structure — a pullback close in my favour, not a blind cross. Divergence alone is never an entry in my system; it is a warning to tighten up or skip.
How is KST different from the Coppock Curve?
Both blend ROCs, but Coppock uses two ROCs (11 and 14) with a ten-period weighted average as a slow monthly bias filter, while KST uses four ROCs (10, 15, 20, 30) with individual smoothing, weights of 1, 2, 3 and 4, and a signal line for H4 and daily entries. Coppock tells you the month’s direction. KST tells you whether to take today’s cross.
Why does KST lag, and does that matter?
It lags because it smooths four times and then smooths again for the signal line. It matters if you chase exact bottoms — you will miss them. It matters less on a funded account, where the cost of a false entry against a hard daily limit is usually larger than the cost of entering a little late into a real move.
Does KST work on gold and indices as well as forex?
Yes, with the same settings, because it measures price cycles, not the instrument. My test log includes XAUUSD trades on the same rules. What changes across instruments is the stop distance and therefore the lot size from the grid above — the KST signal itself does not change, but the sizing always does.
Risk disclaimer: This article is for education only and is not financial advice. Trading on a funded account can still lose money, and no indicator removes that risk. Test any indicator on a demo account first, size every trade to your firm’s daily loss limit, and never risk money you cannot afford to lose.
The external reference for the standard formula and defaults is the EBC Know Sure Thing indicator guide, which lists the same ROC periods, smoothing periods and signal line used above. For the funded-account angle, the rest of this article — the bias filter, the sizing grid and the twelve-trade test — is my own system, not theirs.



