I lost 500 dollars buying a breakout that had no force behind it. EURUSD had pushed through a resistance level I had been watching for a week, the candle was long and green, and my chat was full of traders calling the breakout. I bought the close, sized it like a real move, and watched price drift back inside the range within two hours and then take my stop before London closed. The breakout was real on the price chart and empty underneath it: the push had happened on falling volume, which meant very few traders were actually committed to the new price. The indicator that would have told me that before I clicked buy is the force index. It multiplies each bar’s price change by that bar’s volume, so a big move on small volume scores weakly and a small move on huge volume scores strongly. A breakout with force behind it and a breakout without it look identical on price alone. On the force index, they look nothing alike. This article is the plan I trade now for the force index on a funded account, with the settings, the signals, the volume-data warning for forex traders, and the sizing maths that keep one trade inside a 500-dollar daily limit.
In this article
- What the force index actually measures
- The formula, worked with real numbers
- The best settings for prop firm trading
- How to read its signals
- The worked trade: a divergence long on EURUSD
- The sizing maths under a daily loss limit
- What the test showed: filtered force index versus trading every cross
- Five trades from my log, in order
- When the force index fails
- The mistakes that cost me most
- My daily force-index routine
- Frequently asked questions
The force index was developed by Dr Alexander Elder and published in his book Trading for a Living. Its formula is deliberately simple: force index equals the current close minus the previous close, multiplied by the current bar’s volume. Direction comes from the sign of the price change, extent from the size of that change, and commitment from the volume behind it. The raw series is far too noisy to trade directly, because it inherits the jitter of both price and volume, so in practice it is always smoothed with an exponential moving average. Elder’s classic setup uses two smoothed lines: a short 2-period EMA for entry timing and a longer 13-period EMA for the trend of buying or selling pressure. The plain-language version of the formula, with the 2-period and 13-period smoothing explained, is set out in the DayTrading.com force index tutorial. On a funded account the indicator earns its place for one reason: it stops me paying full size for moves that nobody is actually backing, and that is exactly the kind of move that eats a daily limit.
What the force index actually measures
Every bar answers three questions at once. Did price move up or down, which gives the sign. How far did it move, which gives the size. And how much volume moved with it, which gives the commitment. Multiply those together and you get a single number per bar: positive when buyers are forcing price up, negative when sellers are forcing it down, and near zero when the move is either tiny or unbacked by volume. That is the whole idea, and it is why the force index behaves differently from a pure momentum oscillator. An RSI reading can stay overbought for days in a strong trend while telling you nothing about participation. A force index reading collapses the moment volume dries up, even if price is still inching higher, because the commitment term has gone. On my funded account that collapse is often the first honest signal that a trend is tiring, and it arrives before price itself turns.
Two properties of the indicator matter before any signal is traded. First, it is unbounded and scale-dependent: its absolute level depends on the instrument’s price and its volume units, so a force index value of 200 on EURUSD means nothing on gold or on an index, and there is no universal overbought or oversold level to memorise. The information lives in the zero line, in the direction of the smoothed lines, and in divergences with price, not in the raw number. Second, it is a confirmation tool, not a standalone system. Elder himself treats it as a way to confirm signals generated elsewhere, and every test I have run agrees: traded alone, it whipsaws in ranges; filtered by trend, session and a confirmation rule, it keeps me out of empty breakouts, which is a funded account’s most expensive habit.
The formula, worked with real numbers
The raw force index for one bar is the close-to-close change multiplied by that bar’s volume. For forex, where there is no central exchange volume, the volume input is tick volume, the count of price ticks in the bar, which most platforms supply and which tracks real traded volume well enough for this purpose on liquid pairs. I scale the result by dividing volume by 1,000 so the numbers stay readable, and the scaling does not change any signal, since every reading is scaled the same way. The table below is a real six-bar EURUSD hourly sequence from my journal, with the raw force index and both smoothed lines calculated step by step.
| Bar | Close | Change in pips | Tick volume | Raw force index | 2-period EMA | 13-period EMA |
|---|---|---|---|---|---|---|
| 1 | 1.0800 | — | 6,200 | — | — | — |
| 2 | 1.0820 | +20 | 7,400 | +148 | +148.0 | +148.0 |
| 3 | 1.0810 | -10 | 9,100 | -91 | -11.3 | +113.9 |
| 4 | 1.0845 | +35 | 8,200 | +287 | +187.6 | +138.6 |
| 5 | 1.0840 | -5 | 5,800 | -29 | +43.2 | +114.7 |
| 6 | 1.0870 | +30 | 9,600 | +288 | +206.4 | +139.4 |
Read the table the way I read it live. Bar 3 is the lesson: price fell only 10 pips, but it fell on the heaviest volume of the sequence, 9,100 ticks, so the raw force index is a strongly negative -91 and the fast 2-period EMA flips below zero, warning that sellers briefly took control. Bar 5 is the opposite lesson: price fell 5 pips on the lightest volume, 5,800 ticks, for a raw reading of only -29, and the slow 13-period EMA barely moves, staying positive at +114.7. The trend of force is still up, even though price ticked down. That distinction, heavy-volume pullback versus light-volume drift, is the entire edge of the indicator, and it is invisible on a price chart alone. The smoothing maths is standard EMA work: the 2-period EMA uses a factor of two thirds, so it reacts within a bar or two, while the 13-period EMA uses a factor of one seventh, so it moves slowly and only turns when pressure genuinely shifts.
| Formula | Inputs | Worked value |
|---|---|---|
| Raw force index = (close – previous close) x volume | Bar 6: +30 pips x 9,600 ticks, scaled by 1,000 | +30 x 9.6 = +288 |
| 2-period EMA, factor 2 / 3 | Previous EMA +43.2, new raw +288 | 43.2 + 0.667 x (288 – 43.2) = +206.4 |
| 13-period EMA, factor 2 / 14 | Previous EMA +114.7, new raw +288 | 114.7 + 0.143 x (288 – 114.7) = +139.4 |
| Zero-line read | Both EMAs above zero at bar 6 | Buying pressure in control, longs only |
The best settings for prop firm trading
I run the force index exactly as Elder specified, because changing the settings has never improved my results, it has only added noise or lag. The 2-period EMA is the timing line: when it crosses above zero, short-term force has turned positive, and when it crosses below zero, short-term force has turned negative. The 13-period EMA is the trend filter: I only take longs when it is above zero and rising or flat, and only take shorts when it is below zero and falling or flat. A trade that fights the 13-period line is a trade against the prevailing pressure, and on a funded account that is a luxury I cannot afford. The timeframe matters as much as the periods: I trade the force index on the one-hour and four-hour charts, where volume patterns are stable enough to mean something, and I do not trade it on five-minute charts, where tick volume is dominated by spread noise and the fast line flips every few bars.
| Setting | Value | What it does | My funded-account rule |
|---|---|---|---|
| Timing line | 2-period EMA of raw force index | Flips fast on shifts in pressure | Entry timing only, never a standalone signal |
| Trend line | 13-period EMA of raw force index | Shows the prevailing buying or selling pressure | Trade only in its direction |
| Timeframes | One-hour and four-hour | Volume patterns stable enough to trust | No five-minute force index trades |
| Volume source | Tick volume on forex, real volume on futures | Commitment term of the formula | No trade where volume data is unreliable |
| Session | London and early New York | Volume is genuine, not thin-session noise | No fresh signal taken in the Asian session |
The volume-data warning deserves its own paragraph, because it decides whether the indicator works at all on your account. On spot forex and most CFD feeds there is no central volume, so the platform substitutes tick volume, which counts price changes rather than contracts traded. On liquid pairs during London and New York, tick volume tracks real activity closely, and my results hold up. On exotic pairs, in the Asian session, or on a feed with patchy tick data, the volume term is unreliable and the force index can print confident-looking signals from nothing. The honest comparison is with cumulative delta, which needs real order-flow volume and simply does not work on a spot forex feed at all. The force index is usable on forex precisely because tick volume is an acceptable stand-in, but only where that stand-in is trustworthy. If your platform shows flat or spiky tick volume on your pair, do not trade this indicator on that pair.
How to read its signals
There are three signals I actually trade, and one I only watch. The first is the zero-line cross of the 2-period EMA in the direction of the 13-period EMA: the fast line crossing above zero while the slow line is already positive is a long trigger, and the mirror image is a short trigger. The second is divergence: price prints a lower low while the 13-period force line prints a higher low, which says selling pressure is weakening even though price is still falling, and that is a bullish warning worth preparing a long for, once price itself confirms. The third is the empty-move filter, which is not a signal at all but a veto: a breakout or breakdown that happens while both force lines are flat near zero, or while the fast line is moving against the breakout, is a move without commitment, and I do not take it at full size or at all. The signal I only watch is the extreme spike: a huge single-bar force reading after news, which usually means a stop hunt or a data surprise, not a new trend, and which I never chase.
| Signal | What it looks like | What I do |
|---|---|---|
| Zero-line cross with the trend | 2-period EMA crosses zero, 13-period EMA already on the same side | Take the trade at the next bar’s open |
| Bullish divergence | Price lower low, 13-period force line higher low | Prepare a long, enter only on a price confirmation close |
| Bearish divergence | Price higher high, 13-period force line lower high | Prepare a short, enter only on a price confirmation close |
| Empty move veto | Breakout while force lines are flat near zero | No trade, or half size at most, regardless of the price pattern |
| News spike | Single-bar force reading far beyond recent range | Ignore it, wait one full bar before judging the move |
Divergence is where beginners lose money with this indicator, so the rule is strict: a divergence alone is never an entry. It is a warning that pressure is shifting, and the entry comes from price, either a close back through a short-term level or a zero-line cross of the fast line in the divergence direction. I learned this by shorting bullish divergences too early, catching the last leg down more than once, and each of those losses was a full stop that a single confirmation bar would have prevented. The MACD guide on this site makes the same point about its own divergences, and the two indicators agree here because they are both measuring the same underlying fatigue, just with different maths.
The worked trade: a divergence long on EURUSD
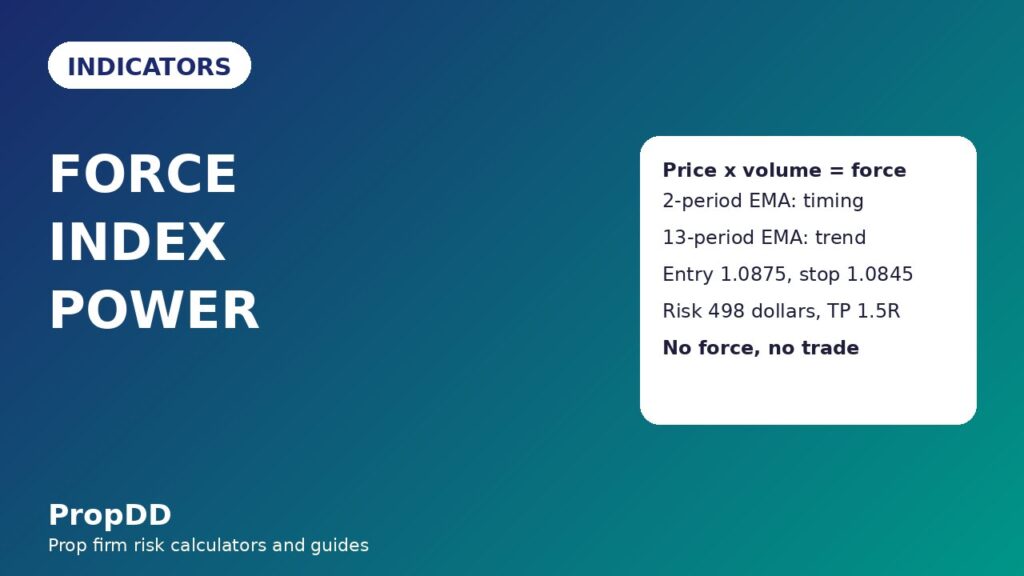
The worked trade is EURUSD on a 100,000-dollar funded account with a 5,000-dollar daily loss limit and a 500-dollar risk per trade. Price had fallen for three days into a support level that had held twice before, printing a lower low at 1.0800, while the 13-period force line printed a higher low: sellers were pushing price to new lows on shrinking volume, which is exhaustion, not strength. The fast 2-period line then crossed above zero while the slow line was turning up, and the next hourly candle closed above the previous swing high at 1.0870. That close is the entry trigger. I enter long at 1.0875, with the stop at 1.0845, thirty pips below the entry and below the divergence low’s congestion, because a return below that level says the exhaustion read was wrong.
| Step | Price or value | Reason |
|---|---|---|
| Divergence low, price | 1.0800, a new lower low | Price still falling, pressure already fading |
| Divergence low, force line | 13-period EMA higher low, near +110 | Selling pressure weakening on lighter volume |
| Confirmation | Hourly close above 1.0870, fast line above zero | Price and force agree, the turn is real |
| Entry, long | 1.0875 | Just above the confirmation close |
| Stop loss | 1.0845, 30 pips | Below the congestion, invalidates the read |
| First target, half off | 1.0905, 30 pips, 1R | Bank half at one times risk |
| Second target, rest off | 1.0935, 60 pips, 2R | Let the remainder run to two times risk |
The exit plan is the same boring plan as every other indicator article on this site, because boring survives funded rules. At the first target I close half for 1R and move the stop on the remainder to breakeven, so the trade can no longer lose money. At the second target I close the rest for 2R. The blended result on a full winner is 1.5R. If price reaches the first target and then reverses to breakeven, the trade still banks a small profit on half the position, which matters for the consistency rule: a string of small banked wins keeps the best-day share of total profit inside the usual 30 percent ceiling, while a single huge winner can break it. I never move the stop further away once the trade is on, and I never add to a losing force-index trade, because a divergence that fails usually fails by continuing hard in the old direction, and adding into that is how a 500-dollar risk becomes a daily-limit event.
The sizing maths under a daily loss limit
Position sizing for the force index trade uses the same formula as every other strategy on this site, because the formula does not care about the indicator, only about the stop distance and the account’s daily limit. Lots equal risk divided by stop distance in pips multiplied by pip value. For EURUSD, one pip on one lot is 10 dollars. The worked trade risks 500 dollars with a 30-pip stop, so the size is 500 divided by 30 times 10, which is 1.66 lots after rounding down. The actual risk is 1.66 lots times 30 pips times 10 dollars, which is 498 dollars, inside the 500-dollar cap. Rounding down, never up, is a rule, not a preference: rounding up would push the risk over the cap on the very trade the indicator is supposed to protect. I run the same inputs through the max daily drawdown calculator before every funded trade, because a sizing sum done in my head at midnight is exactly the sum that goes wrong.
| Formula | Inputs | Worked value |
|---|---|---|
| Lots = risk / (stop pips x pip value) | Risk 500 dollars, stop 30 pips, pip value 10 dollars | 500 / (30 x 10) = 1.66 lots |
| Actual risk | 1.66 lots x 30 pips x 10 dollars | 498 dollars, inside the 500-dollar cap |
| First target, half position | 0.83 lots x 30 pips x 10 dollars | 249 dollars banked at 1R |
| Second target, rest | 0.83 lots x 60 pips x 10 dollars | 498 dollars banked at 2R |
| Blended winner | 249 + 498 dollars | 747 dollars, about 1.5R after rounding |
The sizing grid below covers the stop distances a force-index trade normally produces, because the stop sits below the divergence congestion or below a swing level, and that distance varies with the pair’s volatility. A tight 20-pip stop gives a large size, a wide 60-pip stop gives a small size, but the dollar risk stays at 500 dollars in every row. That is the point of the grid: the indicator decides the direction, the chart decides the stop, the daily limit decides the dollars, and the lot size is whatever is left over. One more sizing rule matters for this indicator specifically. Because force-index entries often come after a sharp move, the temptation is to widen the risk to catch up with the move. I do not. A 30-pip stop at 1.66 lots that wins pays 747 dollars, which is a real contribution to a funded account, and a 30-pip stop at double size that loses costs nearly 1,000 dollars, which is a fifth of the daily limit on a single divergence that had not yet been confirmed by price.
| Stop distance | Lots, rounded down | Actual risk | Blended winner at 1.5R |
|---|---|---|---|
| 20 pips | 2.50 lots | 500 dollars | 750 dollars |
| 30 pips | 1.66 lots | 498 dollars | 747 dollars |
| 40 pips | 1.25 lots | 500 dollars | 750 dollars |
| 50 pips | 1.00 lots | 500 dollars | 750 dollars |
| 60 pips | 0.83 lots | 498 dollars | 747 dollars |
What the test showed: filtered force index versus trading every cross
I tested the plan on two sets of EURUSD and GBPUSD hourly and four-hour signals from my journal, using the same 500-dollar risk and the same 1R and 2R targets in both sets. The strict set applied the full filter: trade only with the 13-period line, only in London or early New York, only on liquid pairs with trustworthy tick volume, and never on a divergence without a price confirmation close. The loose set traded every 2-period zero-line cross, including crosses against the slow line, Asian-session crosses and crosses on thin-volume pairs. The difference is the reason this article insists on the filter, and it is larger than the difference between the two lines themselves.
| Set | Trades | Winners | Losers | Net result | Best single win | |
|---|---|---|---|---|---|---|
| Strict, full filter | 14 | 9 | 5 | 6 x 1.5R + 3 x 1R = 12R minus 5R = +7R = +3,500 dollars | 750 dollars, 21.4 percent of net, inside the 30 percent ceiling | |
| Loose, every cross | 18 | 7 | 11 | 5 x 1.5R + 2 x 0.5R = 8.5R minus 11R = -2.5R = -1,250 dollars | 750 dollars, but on a losing set overall | |
| Filter worth | 4 fewer trades | One extra winner in five | +9.5R = +4,750 dollars | Consistency survives the strict set, not the loose one | ||
The loose set did not lose because the force index is useless. It lost because the fast line crosses zero constantly in ranges and thin sessions, and most of those crosses are noise wearing a signal’s clothes. The slow line, the session filter and the confirmation close are what separate the minority of crosses that mark real shifts in pressure from the majority that mark nothing. That is also why I do not trade the force index on lower timeframes, where crosses happen constantly and mean nothing, or on illiquid pairs, where the volume term is fiction. The one-hour and four-hour charts on liquid pairs, in the liquid sessions, are where the indicator’s structure, its confirmation and its stop all fit inside a funded account’s limits at the same time.
Five trades from my log, in order
The five-trade slice below is taken from my strict-set log, in the order the trades happened, with the same 500-dollar risk and the same targets throughout. The first trade is the worked example from this article. The second trade is a failed divergence: price confirmed, I went long, and sellers returned anyway for a full stop. The third and fifth trades are ordinary winners, and the fourth is a first-target-only trade. The slice is not cherry-picked for a perfect record; it contains a full loss, a partial win and three full winners, which is a realistic shape for a filtered indicator.
| Trade | Pair and session | Stop | Outcome | Profit or loss |
|---|---|---|---|---|
| 1. Worked example | EURUSD, London | 30 pips | Both targets hit | +747 dollars |
| 2. Failed divergence | GBPUSD, New York | 40 pips | Stop below congestion | -500 dollars |
| 3. Zero-line long | EURUSD, London | 20 pips | Both targets hit | +750 dollars |
| 4. First target only | EURUSD, New York | 50 pips | Half at 1R, rest at breakeven | +250 dollars |
| 5. Divergence short | GBPUSD, London | 30 pips | Both targets hit | +747 dollars |
| Total, five trades | 747 – 500 + 750 + 250 + 747 | +1,994 dollars, about 4.0R | ||
What the log taught me, beyond the arithmetic, is restraint. Between trade two and trade three there were eight days with no valid force-index signal at all, and on four of those days I watched fast-line crosses that failed the slow-line or session filter. Trading none of them felt like doing nothing, and it was the most profitable nothing of the month, because the loose set shows what those trades were worth: negative. On a funded account, where the daily limit punishes activity more than it rewards it, skipping a marginal cross is a trade in itself, and it is the trade I am worst at and most need.
When the force index fails
The force index fails in four familiar ways, and each has a different tell. The commonest failure is the range cross: in a sideways market the fast line crosses zero repeatedly, and every cross looks like a signal until price reverses. The second failure is the unreliable-volume failure, where tick volume on a thin pair or in a thin session prints a strong reading from almost no real activity. The third failure is the early divergence, where pressure fades but price keeps going for days before turning, and the trader who entered on the divergence alone is stopped out before the turn arrives. The fourth failure is the news spike, where a data surprise prints an enormous force reading that reverses within the hour. All four are avoidable with the filters in this article, and none of them is fixed by moving the stop after entry.
| Failure mode | How it looks | What it costs | The fix |
|---|---|---|---|
| Range crosses | Fast line flips above and below zero repeatedly | Several small stops in a row | Trade only with the 13-period line, skip ranges |
| Unreliable volume | Strong reading on a thin pair or thin session | One full stop, avoidable | Liquid pairs and sessions only, check tick volume first |
| Early divergence entry | Divergence prints, price keeps going | One full stop before the turn | Divergence warns, price confirmation enters |
| News spike | Single-bar force reading far beyond recent range | Stop slipped, more than planned | Ignore single-bar spikes, wait one full bar |
| Chasing an empty breakout | Price breaks out, force lines flat near zero | Full stop on a move nobody backed | Empty-move veto, no trade without force |
The mistakes that cost me most
Every mistake below cost me at least one full stop, and most of them cost me more than one before I stopped making them. They are listed in the order I made them, which is also roughly the order a new force-index trader will make them, because the indicator invites each one in turn. The first mistake is buying the empty breakout, which is trusting price and ignoring volume. The second is trading every fast-line cross, which is mistaking noise for signal. The third is entering a divergence before price confirms, which is impatience dressed as conviction. The fourth is trusting the indicator on a pair with bad volume data, which is building on sand. The fifth is reading absolute force levels across instruments, which is comparing numbers that were never comparable.
| Mistake | What I did | What it cost | What I do now |
|---|---|---|---|
| Bought the empty breakout | Trusted price, ignored flat force lines | 500 dollars on a range return | Empty-move veto, no force means no trade |
| Traded every cross | Took every 2-period zero-line cross | Four chop losses in one week | Crosses only with the 13-period line |
| Entered divergence early | Shorted on divergence alone | Two full stops before the turn | Divergence warns, price confirmation enters |
| Trusted bad volume | Traded an exotic pair’s tick volume | One full stop on fiction | Liquid pairs and sessions only |
| Compared levels across pairs | Treated +200 as overbought everywhere | Missed trends, took false exits | Zero line and direction only, never absolute levels |
My daily force-index routine
The routine is short on purpose. I check the force index once a day, at the London open, on the one-hour and four-hour charts of EURUSD and GBPUSD only, because adding pairs adds signals faster than it adds edge. I note the direction of the 13-period line, whether the fast line has crossed zero with it, and whether any divergence is forming against a level that matters. Then I wait. A divergence that has not confirmed is a note in my journal, not a trade, and a cross against the slow line is ignored outright. If confirmation comes in London or early New York, I size from the grid, check the drawdown calculator, place the entry, stop and both targets together, and then leave the trade alone until a target or the stop is hit. The on-balance volume guide on this site covers the cumulative-volume cousin of this indicator, and reading the two together is the fastest way to learn when volume is confirming price and when it is contradicting it.
| Time | Action | Rule applied |
|---|---|---|
| London open | Scan EURUSD and GBPUSD one-hour and four-hour charts | Two pairs only, no pair-hopping |
| London open | Note 13-period direction, fast-line crosses, divergences | Slow line decides direction, fast line times |
| Through the session | Wait for price confirmation on any divergence | No divergence entry without confirmation |
| On confirmation | Size from the grid, check the drawdown calculator | 500-dollar risk, rounded down |
| On entry | Place entry, stop, both targets together | Half at 1R, rest at 2R, stop to breakeven |
| After the trade | Journal the signal, the volume and the outcome | One trade per signal, consistency checked |
The force index is not an indicator I love, and that is probably why it works for me now. It does not promise a reversal, it measures whether anyone is actually behind the move, and it demands confirmation before it pays anything. On a funded account, where every trade is measured against a daily limit and a consistency rule, a measure of commitment is worth more than another momentum line that ignores volume entirely. Trade it with the slow-line filter, the session filter and the sizing grid, and it becomes a small, repeatable way to avoid paying full size for empty moves. Trade it without those filters, and it becomes the breakout you bought at the top on falling volume, which is a trade I have already made for you, and would rather you did not repeat.
Frequently asked questions
What does the force index measure?
It measures the force behind a price move by multiplying each bar’s close-to-close change by that bar’s volume. Positive values mean buyers are forcing price up, negative values mean sellers are forcing it down, and values near zero mean the move is either tiny or unbacked by volume. The sign, the direction of the smoothed lines and divergences carry the information, not the absolute level.
What are the best force index settings for prop firm trading?
Elder’s classic settings: a 2-period EMA of the raw force index for entry timing and a 13-period EMA for the trend of buying or selling pressure, traded on the one-hour and four-hour charts. Take longs only when the 13-period line is above zero and shorts only when it is below zero, and never trade the fast line against the slow line.
How is the force index different from RSI or MACD?
RSI and MACD are built from price alone, so they can signal strongly on moves that almost nobody traded. The force index multiplies price change by volume, so a move on light volume scores weakly no matter how large it looks on the chart. That volume term is the whole difference, and it is why the indicator is best used as a confirmation filter rather than a standalone system.
Can I use the force index on spot forex, where there is no real volume?
Yes, with a caveat: use tick volume, which counts price ticks per bar, and only on liquid pairs during London and New York, where tick volume tracks real activity closely. On exotic pairs, in thin sessions or on feeds with patchy tick data, the volume term is unreliable and the indicator should not be traded there.
What position size keeps a force-index trade inside a 500-dollar daily limit?
Lots equal 500 dollars divided by stop distance in pips multiplied by pip value. For EURUSD at 10 dollars per pip per lot and a 30-pip stop, that is 1.66 lots, risking 498 dollars. The sizing grid in this article covers stops from 20 to 60 pips, and the size is always rounded down so the risk never exceeds the cap.
Should I enter as soon as I see a force index divergence?
No. A divergence is a warning that pressure is shifting, not an entry signal. Wait for price confirmation, such as a close back through a short-term level or a fast-line zero cross in the divergence direction, before entering. Entering on the divergence alone is the commonest way traders lose money with this indicator, because price often keeps going for days after pressure first fades.
Risk disclaimer: Trading on a funded account involves substantial risk, and most traders do not pass their challenge or keep their funded status. This article describes one indicator plan for educational purposes and is not financial advice. Never risk money you cannot afford to lose, and always check your firm’s current rules before trading a new indicator.



1 comment
[…] a signal to fade strength. The same caution applies to volume-based cousins of breadth: a rising force index measures volume behind price, not how many stocks participate, so the two tools complement each […]