On a Tuesday morning in October I took three trades I believed were diversified. Long EURUSD, long GBPUSD, short USDCHF — three different pairs, three different charts, each risking two hundred and fifty dollars. Ninety minutes later a CPI surprise moved the dollar, and all three stopped out in the same minute. Minus seven hundred and fifty dollars — fifteen percent of my daily limit — gone in one release, on what I had told myself was two hundred and fifty dollars of risk. The three charts were not three trades. They were one dollar bet wearing three names, and the correlation indicator on my screen had been showing me that fact all morning. I just had not looked at it.
In this article
- What the correlation indicator actually measures
- The Pearson formula, worked with five real days
- The settings I use on a funded account
- Reading it: the five bands and what each one means
- The worked morning: three trades, one dollar bet
- I tested it: the filter against no filter
- When correlation breaks
- My daily routine with the correlation check
- Frequently asked questions
I trade a one hundred thousand dollar account with a five thousand dollar daily loss limit and a ten percent maximum drawdown, risking two hundred and fifty dollars per trade. Every number here comes from that account and from the ten-day test I ran after the CPI morning. The correlation indicator does not predict direction. It answers a narrower question that matters more on a funded account: how much of my risk is really one bet? When two pairs move together, two stops are one stop. The indicator puts a number on that, and the number decides how many trades I am allowed to hold at once.
What the correlation indicator actually measures
The correlation indicator measures how closely two markets move together, as a single number called Pearson’s r, running from minus one to plus one. Plus one means the two markets move in lockstep in the same direction. Minus one means they move in lockstep in opposite directions. Zero means their moves have no reliable relationship at all. It is a rolling calculation over a window you choose — twenty periods on my intraday chart — so the number changes as the relationship changes, and a pair that was independent last month can be joined at the hip this week.
Three things it is not. It is not a direction signal: a reading of plus zero point eight five tells you EURUSD and GBPUSD move together, not whether either one will rise. It is not causation: the two pairs move together because both are priced against the dollar, not because one causes the other. And it is not a hedge by itself: a strongly negative correlation looks like a hedge on paper, but both legs can still lose if the relationship breaks at the exact moment you need it. What it is, is hidden exposure made visible — the difference between the risk you think you took and the risk you actually took.
On a funded account that difference is the whole game. Three trades at two hundred and fifty dollars each look like seven hundred and fifty dollars of risk spread across three ideas. If all three are the same dollar bet, one bad release takes fifteen percent of the daily limit in a single minute. The indicator exists to catch that before the release, not after it.
The Pearson formula, worked with five real days
The formula looks academic until you run it once by hand: take each pair’s daily change, subtract its average, multiply the two deviations day by day, and divide by the square root of the two squared-deviation totals. Here it is with five real days from my log, EURUSD against GBPUSD, daily changes in pips.
| Formula | What it means |
|---|---|
| r = Σ[(x − x̄) × (y − ŷ)] / √[Σ(x − x̄)² × Σ(y − ŷ)²] | x and y are the two pairs’ daily changes; x̄ and ŷ are their averages over the window |
| EURUSD changes (pips): +15, −17, +24, +8, −11 — average +3.8 | GBPUSD changes (pips): +8, −22, +15, +14, −2 — average +2.6 |
| Σ[(x − x̄)(y − ŷ)] = 938.6 | Σ(x − x̄)² = 1202.8 | Σ(y − ŷ)² = 939.2 | r = 938.6 / √(1202.8 × 939.2) = 938.6 / 1062.9 = +0.88 |
Plus zero point eight eight is a strong positive reading: on those five days the two pairs moved together almost as one market. The maths also shows why the window matters. Five days is a demonstration, not a setting — a five-day window whipsaws with every release, while a twenty-period window on the hourly chart smooths the noise without hiding a real regime change. I run the indicator, I do not hand-calculate it every morning; the formula is here so you know what the line on your chart is actually doing, and so you can spot when a vendor’s “correlation” number is measuring something else entirely. The Correlation Meter on TradingView plots the same Pearson calculation between any two symbols, which is the version I check before London.
The settings I use on a funded account
I use two windows and one rule: twenty periods on H1 for the intraday read, fifty on H4 for the swing read, which tells me whether today’s correlation is a real relationship or a one-week accident. The bands are plus and minus zero point seven zero — beyond them, two pairs count as one bet — and a ten-period moving average over the correlation line filters the jitter, so I act on the trend, not on a single hourly print.
| Setting | My funded-account value | Why |
|---|---|---|
| Intraday window | 20 periods, H1 | Matches the pairs I trade today; fast enough to catch a regime change |
| Swing window | 50 periods, H4 | Confirms the relationship is real, not a one-week accident |
| Strong band | +0.70 and −0.70 | Beyond this, two pairs count as one bet for sizing |
| MA overlay | 10 periods on the r line | Filters hourly jitter; I act on the trend, not one print |
| Check times | London open, New York open | Correlations shift after releases; a morning reading is stale by lunch |
| Maximum per cluster | 1 trade, $250 risk | One cluster, one idea, one risk — never three trades on one bet |
The maximum-per-cluster row is the rule that does the work. When EURUSD and GBPUSD read plus zero point eight five, I am allowed one trade across the two of them, risking two hundred and fifty dollars — not one on each. If I genuinely want exposure to both, I split the two hundred and fifty dollars between them. My position sizing guide covers the lot maths; the correlation rule decides how many of those lots belong to the same idea.
Reading it: the five bands and what each one means
Read the number in bands, not decimals — nobody trades differently on plus zero point six two versus plus zero point six five. Five bands cover everything I need, each with a funded-account action attached.
| Reading (r) | What it means | My funded-account action |
|---|---|---|
| Above +0.70 | Strong positive — same direction, same bet | One trade per cluster; split $250 across the pair if I want both |
| +0.30 to +0.70 | Moderate positive — related, not identical | Two trades allowed, but halve the second one’s risk to $125 |
| −0.30 to +0.30 | Weak — near-independent markets | Trade both normally; this is real diversification |
| −0.70 to −0.30 | Moderate negative — opposite lean | Opposite directions count as the same bet; size accordingly |
| Below −0.70 | Strong negative — opposite direction, same bet | A short here equals a long there; one trade per cluster |
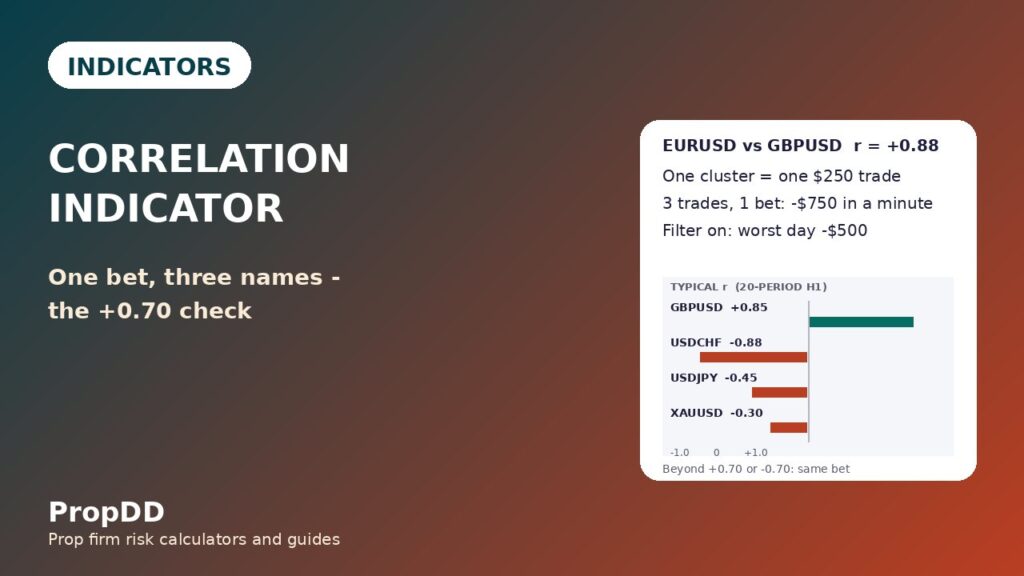
The strong-negative row is the one traders get wrong most often. Short USDCHF when EURUSD is long is not a hedge and not diversification — at minus zero point eight eight the two positions are the same trade in a mirror, and a dollar rally stops both of them out. From my own log, twenty-period H1: EURUSD against GBPUSD sits near plus zero point eight five, EURUSD against USDCHF near minus zero point eight eight, GBPUSD against USDCHF near minus zero point seven nine, EURUSD against USDJPY near minus zero point four five, and EURUSD against XAUUSD near minus zero point three zero. They drift week to week, which is why the indicator is checked daily rather than memorised.
The worked morning: three trades, one dollar bet
Here is the CPI morning rebuilt with the numbers I should have checked first. The correlations that morning, twenty-period H1, were EURUSD against GBPUSD plus zero point eight five, EURUSD against USDCHF minus zero point eight eight, and GBPUSD against USDCHF minus zero point seven nine. Every pair I held was the same dollar view, and the effective risk was not the seven hundred and fifty dollars I had added up — it was six hundred and eighty-two dollars and fifty cents riding on a single direction, because the correlated legs move together almost one for one.
| Trade that morning | Planned risk | Correlation to EURUSD | Effective risk on the dollar view |
|---|---|---|---|
| Long EURUSD | $250 | +1.00 (the base leg) | $250.00 |
| Long GBPUSD | $250 | +0.85 | $212.50 |
| Short USDCHF | $250 | −0.88 (mirror = same direction) | $220.00 |
| Total | $750 | One dollar bet, three names | $682.50 |
The CPI print came in hot, the dollar jumped, and all three stops filled within a minute: minus seven hundred and fifty dollars, fifteen percent of the five thousand dollar daily limit, on a morning I had budgeted two hundred and fifty. The correlation rule I trade now would have allowed exactly one of those three trades. The other two ideas were not wrong — the levels were fine, the entries were fine — but they were the same idea, and one idea gets two hundred and fifty dollars, not seven hundred and fifty. That is the whole article in one sentence: one trade per cluster, and the cluster is defined by the indicator, not by the pair names. My one-pair guide makes the same point from the other side — fewer, better ideas beat a book full of the same bet — and my multiple accounts guide shows how the same stacking mistake happens across accounts instead of across pairs.
I tested it: the filter against no filter
After the CPI morning I ran the same ten trading days twice in my log: once taking every setup I liked, and once taking only one trade per correlated cluster. The market data was identical; only the filter changed. I set the guard levels on my max daily drawdown calculator first, so the one-thousand-dollar daily stop — twenty percent of the firm’s limit — came from maths, not feeling.
| 10-day test | No correlation filter | Correlation filter on |
|---|---|---|
| Trades taken | 18 trades | 12 trades |
| Correlated-loss days (2+ linked trades losing together) | 6 days | 0 days |
| Worst single day | −$1,500 (30% of the daily limit) | −$500 (10% of the daily limit) |
| Days stopped by my $1,000 personal guard | 1 day | 0 days |
| 10-day net result | +$1,100 | +$1,850 |
The filter took a third fewer trades and made more money, because it removed the days when two or three stops fired on the same release. The worst day fell from minus one thousand five hundred to minus five hundred, and the personal guard never fired once with the filter on. Fewer trades is not a weakness on a funded account. It is the mechanism that keeps the daily loss limit intact — the same lesson my personal daily stop guide teaches from the other end, and the reason I now check correlation before I check entries, every single morning.
When correlation breaks
The indicator fails in three specific ways, and I have met all three. First, in a crisis, correlations spike toward plus one across everything — the dollar jumps, gold jumps with it, yen pairs follow, and the diversification the indicator promised the day before evaporates in one session. A reading of minus zero point three zero on Monday is not a promise for Thursday. Second, the indicator is backward-looking: a twenty-period window needs twenty periods to notice that a relationship has changed, so the first day of a new regime trades on the old number. Third, a hedge built on a strong negative correlation can fail exactly when it is needed most, because the correlation itself is what breaks — the two legs that always moved in opposite directions suddenly move together, and both lose.
Three rules save it. One: never size a hedge as if the correlation were a guarantee — size it as if it might break, because one day it will. Two: re-check after every red-folder release, since releases rewrite correlations. Three: when H1 and H4 disagree, trust the H4 and trade the smaller size — the short window is usually the one being fooled by the week’s news.
My daily routine with the correlation check
The routine is boring, and boring is the point. I check correlation before I check entries, and I write the clusters down before I place the first order — never after, because after is when the justifications start. The table below is the routine I actually follow, including the two checks that have saved me more money than any entry signal: the morning cluster list and the hard stop at one thousand dollars of daily loss.
| Time (PKT) | Step | What I do |
|---|---|---|
| 12:30 | Check | Read the 20-period H1 correlations for every pair I might trade; write the clusters down |
| 13:00 | Plan | Mark H1 levels; one trade per cluster, risk split if I want two pairs from it |
| 13:30 – 16:00 | London | Written setups only; lots from the sizing guide; no second trade in the same cluster |
| 18:30 – 21:00 | New York | Re-check correlations after red-folder news; new regime means new clusters |
| 21:30 | Close | Log every trade with its cluster; daily loss at $1,000 means stop for the day |
The one thousand dollar daily stop is twenty percent of the firm’s limit, and it is what makes the correlation check safe rather than merely clever: the indicator tells you how much you are really risking, and the stop decides when that risk has cost enough for one day. How much to risk per trade is the guide I point new traders to first — the cluster rule only limits how many trades share one idea, and the risk on that idea still has to be right.
Frequently asked questions
What correlation value is too high for a funded account?
Plus zero point seven zero, or minus zero point seven zero, is my line. Beyond it, two pairs count as one bet for sizing: one trade per cluster, two hundred and fifty dollars of risk, split between the pairs if I want both. Between plus and minus zero point three zero the pairs are near-independent and I trade them normally.
Can I use correlation to hedge a trade?
You can, but a hedge is not a free lunch. A strongly negative correlation means the two legs usually move in opposite directions — usually, not always. Size the hedge as if the correlation might break, because in a crisis it often does, and both legs can lose on the same day. I use correlation to avoid accidental double exposure, not to build hedges I depend on.
Which pairs are most correlated?
On my log, EURUSD and GBPUSD sit near plus zero point eight five, and EURUSD against USDCHF near minus zero point eight eight — the two classic dollar pairs. USDJPY runs moderately negative against EURUSD, around minus zero point four five, and XAUUSD is weak, around minus zero point three zero. All of these drift, so check the indicator rather than memorising the numbers.
Does correlation work on gold?
Partly. Gold correlates weakly with the dollar pairs most weeks — around minus zero point three zero against EURUSD on my log — which makes it genuinely useful diversification. But gold’s correlation spikes in a crisis, when everything moves with risk sentiment, so do not count on it as a hedge on the one day you need it most.
What period should I use for the correlation indicator?
Twenty periods on H1 for the pairs I trade today, fifty periods on H4 to confirm the relationship is real. Shorter windows whip around with every release; longer windows are too slow to catch a regime change. A ten-period moving average over the correlation line itself smooths the jitter.
Does the correlation indicator replace position sizing?
No. It tells you how much you are really risking; sizing still decides the dollars. The indicator says three trades are one bet — the sizing guide says that bet is worth two hundred and fifty dollars. One without the other leaves the account exposed either way.
Risk disclaimer: Trading funded accounts involves substantial risk of loss and is not suitable for every trader. The correlations, the figures and the ten-day test here describe my own account and my own log, not a promise of similar results.