I turned a 400-dollar winner into a 600-dollar losing week by trading a broadening formation as if it were a range. The chart was GBPUSD on the four-hour timeframe, and at first glance it looked like the kind of box I trade all the time: a high near 1.2820, a low near 1.2720, price bouncing between the two. I bought the low and sold the high, and the first round even paid me 400 dollars. Then the next low came in lower, at 1.2680, and the next high came in higher, at 1.2860. My range was not a range. It was widening, one swing at a time, and every stop I had placed using the old edges was now sitting in the middle of the new swing. The third low, at 1.2640, took out my buy, and the third high, at 1.2900, took out my sell. That week taught me the one rule that now governs how I trade this pattern: I never trade inside a broadening formation. I wait for the breakout, and I trade only that.
In this article
- What a broadening formation actually is
- The five swings I need before I call it a formation
- The breakout-only rules: setup, entry, stop and targets
- The maths: height, measured move and position size
- My session and news filters
- I tested it: twelve breakout trades against twelve inside swings
- When the broadening formation fails
- Frequently asked questions
A broadening formation is a chart pattern in which price swings get wider instead of narrower. Each new high is higher than the last and each new low is lower than the last, so the two boundary lines diverge instead of converging. It is the mirror image of a triangle, and that single difference changes everything about how it must be traded on a funded account. In a triangle, the range shrinks and stops get tighter. In a broadening formation, the range grows, stops placed on old levels get hunted, and patience inside the pattern is punished. This guide covers the exact formation I trade, the five swings I require, the breakout-only rules, the sizing maths on a 100,000-dollar account with a 5,000-dollar daily limit, and a twelve-trade test.
What a broadening formation actually is
Picture two lines on a chart that are moving apart. The upper line connects rising highs, the lower line connects falling lows, and each swing between them travels further than the one before it. The pattern usually appears after a strong move, when buyers and sellers are both becoming more aggressive rather than one side giving up: buyers push each rally a little higher, sellers push each dip a little lower, and the market gets louder instead of quieter. Volume often rises as the formation develops, which is the opposite of a triangle, where volume usually dries up as the range narrows.
There are two shapes, trading as mirror images. In an ascending broadening formation the breakout usually comes through the upper line; in a descending one, through the lower line. I trade both with the same rules, flipped, but I never assume direction from the shape alone: an ascending formation can break down violently, because every buyer who bought the widening lows is trapped at once. The breakout candle, not the shape, decides the direction. Note the contrast with the diamond pattern strategy, which starts as a broadening formation and then narrows again; a pure broadening formation never narrows, it keeps widening until price escapes through one side.
The five swings I need before I call it a formation
I do not trade the first widening swing I see. Most widening is just noise. My rule is five swings, with each new extreme beyond the last, and fewer than five means I am guessing at a pattern that has not formed yet. Here is the exact sequence from the GBPUSD week that taught me the lesson, on the four-hour chart:
| Swing | Level | What it must show |
|---|---|---|
| Swing low 1 | 1.2720 | First dip of the formation, the starting floor |
| Swing high 1 | 1.2820 | First rally, the starting ceiling |
| Swing low 2 | 1.2680 | Lower than low 1 by 40 pips: the range is widening |
| Swing high 2 | 1.2860 | Higher than high 1 by 40 pips: both sides widening |
| Swing low 3 | 1.2640 | Lower than low 2 by 40 pips: three falling lows confirmed |
| Swing high 3 | 1.2900 | Higher than high 2 by 40 pips: three rising highs confirmed |
Each swing extends the last by 40 pips, and the pattern is only complete at swing high 3. Before that point I am watching, not trading. I also require at least ten four-hour candles of formation time, and a height of at least 100 pips on GBPUSD and EURUSD; smaller than that, the stop distances and spread costs eat the trade before it starts.
The breakout-only rules: setup, entry, stop and targets
Here are the full rules, exactly as I trade them. The setup is the five-swing formation on the four-hour chart, with the height measured from the lowest low to the highest high. The entry comes only after a four-hour candle closes beyond the boundary line: above the highest high for a long, below the lowest low for a short. A wick through the line does not count, because wicks through broadening boundaries are the pattern’s favourite trap. After the closing breakout, I wait for a retest: price must come back to the broken level and hold it on a one-hour closing basis. If price runs away without a retest, I let it go: chasing a broadening breakout is how a funded account gives back a week’s profit in one afternoon, because these breakouts retrace further than normal ones.
The stop goes below the retest swing low for a long, or above the retest swing high for a short, with a small buffer for spread. It does not go below the pattern low. That distinction is the whole sizing story: a stop below the lowest low of a 260-pip formation is a 265-pip stop, and no funded-account maths survives that. The targets are split: half the position off at 1R, the rest at 2R. The textbook measured move, the full pattern height projected from the breakout, is noted on the chart but never held for on a funded account, because a 260-pip runner routinely retraces through a trailing drawdown limit on the way.
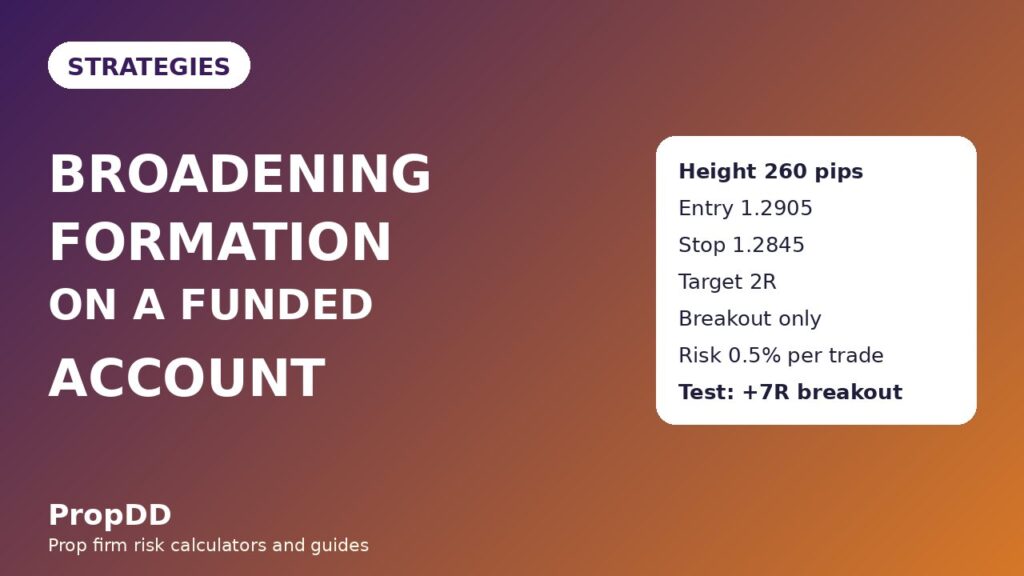
The breakout was a four-hour close above 1.2900 at 1.2912. Price pulled back to 1.2905, held above the broken level on the hourly chart, and I entered long there. The retest swing low was 1.2862, so the stop went 17 pips below it, at 1.2845, giving a 60-pip stop. Target 1 was 1.2965, 60 pips for 1R, where half came off. Target 2 was 1.3025, 120 pips for 2R, where the rest came off. The textbook measured move would have been 1.3160, but by the time price reached 1.3100 two days later, my profit was already banked and my daily limit was never in danger.
The maths: height, measured move and position size
The account in every figure here is 100,000 dollars with a 5 percent daily loss limit, which is 5,000 dollars, and my personal daily stop is half of that, 2,500 dollars. My risk per trade is 0.5 percent, which is 500 dollars. Those three numbers drive every calculation in this section, and the formula box below shows them working on the GBPUSD trade:
| Figure | Calculation | Result |
|---|---|---|
| Pattern height | Highest high 1.2900 minus lowest low 1.2640 | 260 pips |
| Textbook measured target (long) | Breakout 1.2900 plus height 260 pips | 1.3160 (noted, not held for) |
| Stop distance | Entry 1.2905 minus stop 1.2845 | 60 pips |
| Position size | 500 dollars divided by (60 pips x 10 dollars per pip per lot) | 0.83 lots |
| Target 1 (half off) | 0.41 lots x 60 pips x 10 dollars | Plus 246 dollars |
| Target 2 (rest off) | 0.42 lots x 120 pips x 10 dollars | Plus 504 dollars |
| Total if both targets hit | 246 plus 504 dollars, against 500 dollars risked | Plus 750 dollars, or 1.5R |
That sizing table is also why the stop placement matters so much. If I had placed the stop below the pattern low at 1.2640, the stop distance would have been 265 pips, and the same 500 dollars of risk would have allowed only 0.19 lots. A 2R win on that size needs a 530-pip move to collect it, which almost never arrives before a retracement stops the trade out on trailing drawdown. The retest stop keeps the trade inside the funded account’s reality: a normal distance, a normal size, and targets that price can actually reach. Before I place any broadening trade I check the exact daily-limit figure with the Max Daily Drawdown Calculator, and the Rectangle Breakout Calculator runs the same height-and-target maths on fixed-level boxes as a useful cross-check.
Here is the sizing grid I keep beside the chart. It uses the same 500 dollars of risk, so only the stop distance changes the size:
| Stop distance | Position size | Loss if stopped | Share of the 5,000-dollar daily limit |
|---|---|---|---|
| 40 pips | 1.25 lots | 500 dollars | 10 percent |
| 60 pips | 0.83 lots | 500 dollars | 10 percent |
| 80 pips | 0.63 lots | 500 dollars | 10 percent |
| 100 pips | 0.50 lots | 500 dollars | 10 percent |
| 120 pips | 0.42 lots | 500 dollars | 10 percent |
Two losses in a day cost 1,000 dollars, which is 20 percent of the firm’s daily limit and 40 percent of my personal stop, so my rule is two broadening trades per day at most, and the second only after the first has closed. Five consecutive losses would reach my personal stop, and I stop there long before the firm’s limit. I manage the open trade with partial closes, the habit in my partial closes guide, because banking half at 1R turns the rest of the trade into a free look at the 2R target.
My session and news filters
A broadening breakout that fires in thin liquidity is usually a fakeout, so the session filter is not optional. I trade these breakouts only during the London session and the London-New York overlap, when GBPUSD and EURUSD have the depth to hold a broken level on a retest. I take no new entries during the Asian session, none in the final hour before the New York close, and none within thirty minutes of a red-folder release on the pair.
| Routine step | Rule | Why it is there |
|---|---|---|
| 1. Check the limits | Write down the 5,000-dollar firm limit and the 2,500-dollar personal stop | Every size in the trade comes from these two numbers |
| 2. Confirm five swings | Three falling lows and three rising highs, each beyond the last | Fewer swings is a guess, not a pattern |
| 3. Measure the height | Highest high minus lowest low, at least 100 pips | Smaller patterns cannot pay their spread and stop costs |
| 4. Wait for the close | Four-hour candle closes beyond the boundary line | Wicks through the line are the pattern’s main trap |
| 5. Wait for the retest | Hourly close holds the broken level, then enter | Retest entries cut the stop from 265 pips to 60 pips |
| 6. Session and news check | London or overlap hours only, no red-folder news within 30 minutes | Thin-liquidity breakouts fail more often than they run |
| 7. Size and split | 500 dollars risk, half off at 1R, rest at 2R | Banking half early protects the daily limit on every trade |
That routine is deliberately slow: a formation takes days to build on the four-hour chart, and the breakout trade is one entry after days of waiting. The trend pullback strategy I trade alongside it uses the same patience: the setup does most of the work, and my job is to refuse everything that is not the setup.
I tested it: twelve breakout trades against twelve inside swings
I logged twelve consecutive broadening trades taken strictly by these rules, on GBPUSD and EURUSD over eight weeks, and twelve trades taken the way I used to trade this pattern, buying the lows and selling the highs inside the formation. The risk was 500 dollars on every trade in both sets. The breakout set took only closing breakouts with retest entries; the inside set took the third, fourth and fifth swings of the same formations. Here is the breakout set, trade by trade:
| Trade | Pair and direction | Entry and stop | Result |
|---|---|---|---|
| 1 | GBPUSD long | 1.2905 / 1.2845 | Plus 2R |
| 2 | EURUSD long | 1.0920 / 1.0870 | Plus 1R |
| 3 | GBPUSD long | 1.2740 / 1.2680 | Minus 1R |
| 4 | EURUSD short | 1.0780 / 1.0840 | Plus 2R |
| 5 | GBPUSD long | 1.3010 / 1.2950 | Plus 2R |
| 6 | GBPUSD long | 1.2880 / 1.2820 | Minus 1R |
| 7 | EURUSD long | 1.0960 / 1.0905 | Minus 1R |
| 8 | GBPUSD short | 1.2690 / 1.2750 | Plus 1R |
| 9 | EURUSD long | 1.1040 / 1.0980 | Plus 2R |
| 10 | GBPUSD long | 1.2820 / 1.2760 | Minus 1R |
| 11 | EURUSD short | 1.0710 / 1.0770 | Plus 2R |
| 12 | GBPUSD long | 1.2950 / 1.2890 | Minus 1R |
Check the arithmetic: seven wins and five losses. Five wins paid 2R and two wins paid 1R, giving 12R of winners, and five losses cost 5R, leaving a net of plus 7R. At 500 dollars of risk that is plus 3,500 dollars. The best single trade paid 1,000 dollars, which is 28.6 percent of the 3,500-dollar net, inside a 30 percent consistency cap. The worst day was two consecutive losses, 1,000 dollars, and the day ended there by rule. The inside-swing set, by contrast, produced four wins at 1R and eight losses at 1R, a net of minus 4R, or minus 2,000 dollars, and three of its losses were stops placed on old edges that the next swing ran straight through. The filter is the edge: the same formations, the same pairs, and the only difference was refusing to trade inside them.
When the broadening formation fails
The most common failure is the wick breakout: price spikes through the boundary on a thin-liquidity candle and closes back inside the formation. My rules already refuse that trade, because I require a four-hour close beyond the line, but the temptation to enter on the wick is real, especially after days of waiting. The second failure is the busted breakout: price closes beyond the line, I enter on the retest, and then price closes back inside within two four-hour candles. When that happens I exit immediately, even at a small loss, and I never flip the trade, because a busted broadening breakout often runs hard in the opposite direction.
The third failure is the news breakout, which is why the thirty-minute blackout exists: a release can drive price through a boundary with no real order flow behind it, and the reversal stops out the breakout entry within the hour. The fourth failure is size: a formation under 100 pips tall on GBPUSD or EURUSD produces stops so tight that spread and slippage alone can turn a winning idea into a stopped trade, so I skip those patterns entirely. The fifth failure is overtrading the pattern: taking a second broadening trade on a correlated pair while the first is still open. GBPUSD and EURUSD breakouts often fire together, and two positions on the same dollar move are one trade wearing two tickets. One broadening position at a time is my rule.
For the textbook version, the EBC guide to spotting and trading the broadening formation covers the same widening structure and measured-move projection. My rules differ in one deliberate way: the textbook holds for the measured move, and I bank at 2R, because a funded account is governed by daily and trailing limits, not by textbook targets.
Frequently asked questions
How is a broadening formation different from a triangle?
A triangle converges into a smaller range; a broadening formation diverges into a wider one. Stops tighten inside triangles, but stops placed on old edges inside a broadening formation get run over by the next, wider swing.
How many swings confirm the pattern?
Five swings, each new extreme beyond the last, spread over at least ten four-hour candles. Fewer swings can look like a formation on one volatile day but carry no structure worth risking funded capital on.
Why not trade the swings inside the pattern?
Each swing is wider than the last, so a stop on the previous edge sits inside the next swing’s path. My test showed it directly: inside swings lost 4R, breakout-only made 7R on the same formations.
Why is my stop not below the pattern low?
On a 260-pip formation that stop is 265 pips away, cutting the position to 0.19 lots and needing a 530-pip move to pay 2R. The 60-pip retest stop keeps the size normal and the targets reachable.
What size broadening formation is too small to trade?
Under 100 pips tall on GBPUSD or EURUSD I skip it: stops get too tight for spread and slippage, the 1R exit barely covers costs, and the pattern shows too little disagreement to produce a real breakout.
Can I trade a broadening breakdown the same way as a breakout?
Yes, mirrored: a four-hour close below the lowest low, a retest holding below the broken level on the hourly chart, a stop above the retest swing high, and split exits at 1R and 2R. Breakdowns are often faster, so I am stricter about the retest, never looser.
Trading involves substantial risk of loss. The figures here come from my own funded-account testing and are educational examples, not a promise of results. Always check your prop firm’s current rulebook before trading any strategy, and never risk money you cannot afford to lose.



