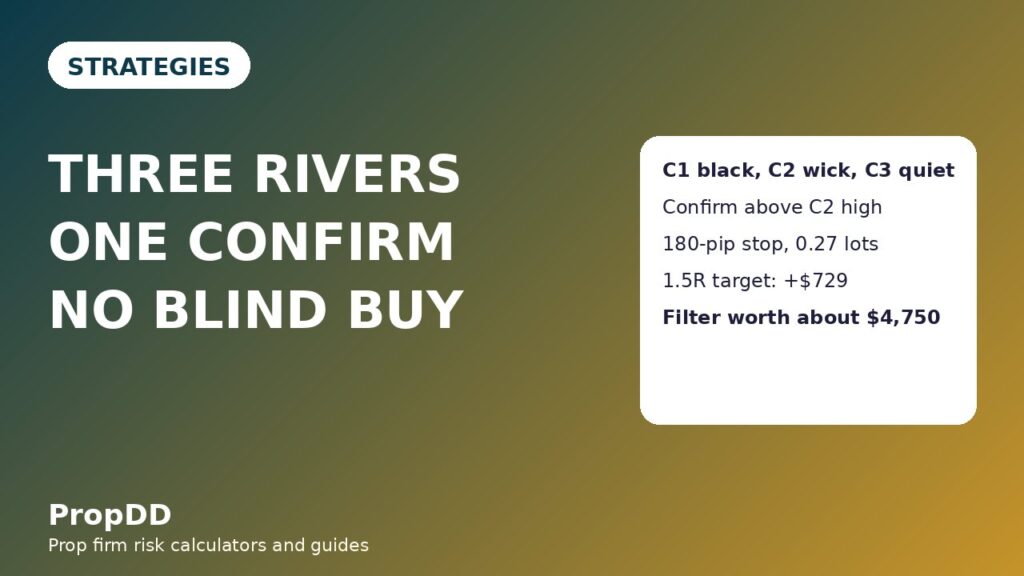
I lost $500 on GBPUSD in one day because I bought a pattern the textbook promised was a reversal. Three candles had printed at the bottom of a two-week decline: a long black candle, a second black candle with a long lower wick that made a new low, and a small white candle that stayed above that low. Every candlestick book I owned called it a unique three river bottom, a bullish reversal, and I bought the close of the third candle with a normal size. The next day price broke below the second candle’s low and fell another 200 pips. The pattern had not reversed anything. It had continued the decline, exactly as the tested data says it does 60 percent of the time. That was the day I stopped trading candlestick names and started trading candlestick evidence.
In this article
- What the unique three river bottom actually is
- The Bulkowski problem: the textbook says reversal, the data says continuation
- The six rules I trade it by
- Unique three river bottom versus the patterns it resembles
- Entry, stop loss and take profit
- The sizing maths under a daily loss limit
- My worked trade: three candles on GBPUSD
- The fourteen-trade test: confirmation versus blind reversal
- Session and news filters
- When the pattern fails
- Mistakes I made with three-river bottoms
- How the three-river bottom fits prop firm rules
- My daily three-river routine
- Frequently asked questions
I trade a $100,000 funded account with a $5,000 daily loss limit and a 5% maximum drawdown. My rule is simple: no single trade risks more than $500, which is 0.5% of the account and 10% of the daily limit. The unique three river bottom fits that rule only if you trade it my way, which is the opposite of the textbook way. I never buy the third candle. I wait for a confirmation close above the second candle’s high, and if price breaks below the second candle’s low first, I walk away. This guide covers the anatomy candle by candle, the data problem that makes the textbook version dangerous, the six rules I trade it by, how it differs from the patterns it resembles, the exact entry, stop and target maths, one worked GBPUSD trade, and the fourteen-trade test that proved the confirmation filter is worth $4,750.
What the unique three river bottom actually is
The unique three river bottom is a three-candle bullish reversal that forms at the end of a downtrend. The first candle is a long black candle: the decline is still in charge, and sellers close the session near its low. The second candle is black too, but its body sits inside the first candle’s body, and its long lower shadow reaches below the first candle’s low to a new low. Buyers stepped in at that low and pushed price back up before the close, so the body is small even though the candle made a new low. The third candle is a small white candle that closes below the second candle’s close, and its low stays above the second candle’s low. Nothing has rallied yet. The low held for one quiet session, and that is all the third candle proves.
The pattern is rare, and that is part of its value and part of its danger. It needs three candles to line up in a specific order, at the end of a real decline, with the second candle’s shadow making a new low and the third candle staying above that low. Most bottoms do not look like this. Most bottoms are messy, with mixed candles and no clear signal. When a unique three river bottom does print cleanly, it is worth waiting for, because the new low that was rejected is a real level. But rarity also means the pattern is hard to test, and the testing that exists does not flatter it. The classic definition, published in the Bulkowski unique three river bottom reference, is three candles: a tall black candle in a downtrend, a second black body inside the first with a lower shadow below the prior low, and a short white candle that stays below the second candle’s body.
| Candle | Colour and size | What it must do | What it means |
|---|---|---|---|
| Candle 1 | Long black body | Closes well below its open, deep in a downtrend | Sellers are still in charge |
| Candle 2 | Small black body, long lower shadow | Body sits inside candle 1’s body; shadow makes a new low below candle 1’s low | Sellers pushed to a new low, buyers pushed back |
| Candle 3 | Small white body | Closes below candle 2’s close; low stays above candle 2’s low | The low held for one quiet session; no rally yet |
Two details decide whether the pattern counts. First, the second candle’s body must sit inside the first candle’s body. If the second candle’s body hangs below the first candle’s close, the two candles are just two black candles in a row, not a pattern. Second, the second candle’s lower shadow must be long, at least twice the length of its body. A short shadow means nothing was tested at the low, and the candle is just a small black candle, not a rejection. The new low on the second candle’s shadow is the pattern’s signature, and without it there is no trade.
The Bulkowski problem: the textbook says reversal, the data says continuation
This is the section that changes how you trade the pattern, so read it before the rules. The unique three river bottom is filed in the textbooks as a bullish reversal. Thomas Bulkowski tested it across more than 4.7 million candle lines and found something else: it actually acts as a bearish continuation 60 percent of the time. He found only 80 clean examples in all those millions of candles, which is why the frequency rank is 89 out of 103 patterns, and the overall performance rank is 60 out of 103. The pattern is rare, it does not perform well, and when it does move, its best average move is a drop of 5.6 percent over ten days in a bear market, on a down breakout. Those are not the statistics of a reversal you buy blindly. They are the statistics of a pattern you trade only with confirmation, or not at all.
| Measure | What Bulkowski found | What it means for my trading |
|---|---|---|
| Theoretical performance | Bullish reversal | What the textbooks promise |
| Tested performance | Bearish continuation 60% of the time | Buying the third candle loses more often than it wins |
| Frequency rank | 89 out of 103 | Very rare: only 80 examples in 4.7 million candle lines |
| Overall performance rank | 60 out of 103 | Even when found, it does not outperform |
| Best average move in 10 days | Minus 5.60%, bear market, down breakout | The biggest move is down, not up |
| Best percentage meeting price target | 52%, bull market, up breakout | Even the best case barely beats a coin flip |
| Sample size | 80 patterns, some statistics on 13 or fewer | Small samples: trust the direction of the evidence, not the decimals |
The honest conclusion is not that the pattern is useless. It is that the third candle is not an entry signal. The third candle only tells you the low held for one session, and a low that held for one session is not a reversal. The confirmation close is what turns this pattern into a trade: a later candle closing above the second candle’s high is the first close that shows buyers actually taking over. A close below the second candle’s low fails the idea completely, because sellers got through the level buyers defended. I trade the confirmation, not the pattern, and that single change is the whole strategy. If you want the same discipline on a five-candle top, my ladder top guide shows a pattern where the confirmation candle does the filtering in exactly the same way.
The six rules I trade it by
A unique three river bottom without rules is just three candles on a chart, and three candles on a chart will happily take your money. I trade it with six rules, and I skip the pattern if any one of them fails. The rules exist because every one of them was written after a loss: the trend rule after I bought a three-river bottom in the middle of a range, the shadow rule after I traded a second candle with a stubby wick, and the confirmation rule after I bought the third candle and watched price break the low the next day, which is the $500 loss this article opens with.
| Rule | The rule | Why it exists |
|---|---|---|
| 1. Real downtrend first | Price must have fallen at least 200 pips from the last swing high before candle 1 | A three-river bottom in a range is just three random candles |
| 2. First candle is long and black | Candle 1’s body is 60 pips or more on the daily chart | A small first candle means a weak decline, not a climax |
| 3. The tested low | Candle 2’s body sits inside candle 1’s body, its lower shadow is at least twice its body, and its low is below candle 1’s low | The shadow proves sellers reached a new low and buyers pushed back |
| 4. The quiet third candle | Candle 3 is a small white candle, closes below candle 2’s close, low above candle 2’s low | The low held for one session; no rally is claimed yet |
| 5. Confirmation or nothing | Enter only after a later candle closes above candle 2’s high; if any candle closes below candle 2’s low first, the pattern is dead | Bulkowski’s data says the unconfirmed pattern continues down 60% of the time |
| 6. One pattern, one trade | One long per three-river bottom, at the fixed risk, with no add-ons if price dips | Adding to an unconfirmed reversal doubles the loss on a failed bottom |
Rule 1 is the one traders skip most often, and it is the one that costs the most. A three-river bottom needs a decline to reverse. If price has only drifted down 80 pips from its high, the three candles are not a climax, they are a normal week. I measure the decline from the last clear swing high to the close of candle 1, and I want at least 200 pips on the daily chart, or 100 pips on the four-hour chart. The pattern reverses a trend, and without a trend there is nothing to reverse. Rule 5 is the one that saves the most money: the confirmation close is only a confirmation after it closes. While the candle is forming, it is a live candle, and live candles lie.
Unique three river bottom versus the patterns it resembles
The unique three river bottom is constantly confused with its neighbours, and the confusion is expensive because the neighbours trade differently. The homing pigeon is the most dangerous lookalike: its two candles are identical to this pattern’s first two candles, a long black candle followed by a smaller black candle whose body sits inside the first. The difference is the third candle. A homing pigeon has no third candle, and it is a weaker, earlier signal. If you trade the first two candles of a three-river bottom as a homing pigeon, you are trading before the low has been tested by a third session, and you are paying for the pattern’s weakest version.
| Pattern | Candles | Direction | How the three-river bottom differs |
|---|---|---|---|
| Homing pigeon | 2 black, second body inside first | Reversal long, weak | Same first two candles, but no third candle and no new-low shadow required |
| Morning star | Long black, small middle, strong white | Reversal long | Morning star’s third candle is strong and closes above the first candle’s midpoint; the three-river third candle is small and closes below the second candle’s close |
| Three inside up | Long black, small inside candle, white close above candle 1’s high | Reversal long | Three inside up confirms itself with the third candle; the three-river bottom needs a separate confirmation close after the third candle |
| Hammer | 1 candle, long lower shadow | Reversal long | A hammer is a single candle; the three-river bottom needs the inside body and the quiet third session as well |
| Ladder bottom | 3 black, short black with long upper shadow, white | Reversal long | Five candles, not three, and its fourth candle warns with an upper shadow, not a lower one |
| Advance block | 3 white, shrinking bodies, inside opens | Reversal short after confirmation | The opposite end of the market: a top, not a bottom, traded short |
The closest neighbour is the three inside up, which I covered in my three inside up guide. Both start with a long black candle and a small inside candle, and both are long-only after confirmation. The difference is in the third candle: in a three inside up, the third candle is a white candle that closes above the first candle’s high, so the pattern confirms itself. In a unique three river bottom, the third candle is small, closes below the second candle’s close, and confirms nothing, so a fourth candle has to do the confirming. If you cannot tell which one you are looking at, check the third candle’s close against the first candle’s high: if it closed above it, it is a three inside up; if it closed below the second candle’s close, it is a three-river bottom waiting for confirmation. My homing pigeon guide covers the two-candle version of this same idea, and the ladder bottom guide covers the five-candle mirror at a bottom, traded long with the same one-trade, fixed-risk approach.
Entry, stop loss and take profit
Entry is long, and only after a confirmation candle has closed above the second candle’s high. I enter 10 pips above the confirmation candle’s close, on the next candle, so a small dip after the close does not fill me at a worse price and then run me over. If price never trades 10 pips above the confirmation close, I do not chase it: the pattern stays valid for two more candles, and if a candle closes below the second candle’s low in that window, the pattern is dead and I walk away. I never enter on the third candle, and I never enter while the confirmation candle is still forming, no matter how strong it looks.
The stop goes 10 pips below the pattern low, which is the lowest point of candles one to three, usually the second candle’s low. That is a wide stop, because a three-candle pattern on the daily chart is a big structure, and a tight stop gets hunted by the same volatility that built the decline. The wide stop is why the sizing maths matters: at a 180-pip stop distance, the position is small, and that is the point. The first target is one times the risk, at the same distance above the entry as the stop is below it, and I take half the position off there. The second target is two times the risk, and I take the rest off there. If price reaches the first target and then comes back to my entry, I am out at breakeven on the remaining half, which is the only outcome that keeps the account alive through a run of failed bottoms.
| Level | Rule | GBPUSD worked example |
|---|---|---|
| Pattern low | Lowest point of candles 1 to 3 | 1.2540, the second candle’s low |
| Confirmation | A candle closes above candle 2’s high | Close at 1.2700, above candle 2’s high of 1.2690 |
| Entry | Long 10 pips above the confirmation close | 1.2710, after a close at 1.2700 |
| Stop loss | 10 pips below the pattern low | 1.2530, a 180-pip stop |
| Take profit 1 | One times risk, half the position | 1.2890, 180 pips above entry |
| Take profit 2 | Two times risk, the rest of the position | 1.3070, 360 pips above entry |
| Invalidation | A candle closes below the pattern low | Any close below 1.2540 cancels the idea |
The invalidation rule is the stop loss in disguise. If a candle closes below the pattern low, the buyers have failed, the decline is resuming, and the three-river bottom is a story I told myself, not a pattern. I exit at the market and I do not re-enter on the same structure. A pattern that fails is information, and information is only useful if you act on it once.
The sizing maths under a daily loss limit
The three-river bottom’s stop is wide, so the position is small, and that is exactly how it should be. My account is $100,000, my daily loss limit is $5,000, and my risk per trade is $500. GBPUSD pays $10 per pip per standard lot. The formula is the same one I use for every pattern: lots equal risk divided by stop distance in pips times pip value. On the worked trade below, the stop is 180 pips, so the maths is 500 divided by 180 times 10, which is 0.27 lots after rounding down. I always round down, never up, because rounding up is how a $500 risk becomes a $504 risk, and four dollars over the limit is still over the limit.
| Step | Formula | Worked number |
|---|---|---|
| 1. Risk per trade | 0.5% of a $100,000 account | $500 |
| 2. Stop distance | Entry 1.2710 to stop 1.2530 | 180 pips |
| 3. Pip value | GBPUSD, $10 per pip per lot | $10 |
| 4. Position size | 500 divided by (180 times 10) | 0.27 lots, rounded down |
| 5. Actual risk | 0.27 lots times 180 pips times $10 | $486 |
| 6. First target | Half the position at 1 times risk | 0.135 lots, plus $243 |
| 7. Second target | Rest of the position at 2 times risk | 0.135 lots, plus $486 |
| 8. Total if both hit | $243 plus $486 | Plus $729, or 1.5R |
The grid below is the one I keep taped to my monitor. It covers the stop distances a three-river bottom usually produces on the daily chart, from a tight 80-pip pattern to a wide 220-pip one. Every row rounds the size down, and every row keeps the actual risk at or below $500. If your pattern’s stop falls between two rows, use the row below it, the wider stop, the smaller size. The grid is not a suggestion; it is the rule that keeps a wide-stop pattern inside a narrow risk budget. I check my numbers on the max daily drawdown calculator before every trade, because a sizing mistake on a 180-pip stop is a $500 mistake, and I would rather spend thirty seconds checking than a day explaining a breach.
| Stop distance | Lots | Actual risk | First target (1R) | Second target (2R) | Total if both hit |
|---|---|---|---|---|---|
| 80 pips | 0.62 | $496 | Plus $248 | Plus $496 | Plus $744 |
| 100 pips | 0.50 | $500 | Plus $250 | Plus $500 | Plus $750 |
| 120 pips | 0.41 | $492 | Plus $246 | Plus $492 | Plus $738 |
| 150 pips | 0.33 | $495 | Plus $248 | Plus $495 | Plus $743 |
| 180 pips | 0.27 | $486 | Plus $243 | Plus $486 | Plus $729 |
| 220 pips | 0.22 | $484 | Plus $242 | Plus $484 | Plus $726 |
My worked trade: three candles on GBPUSD
The trade happened on the daily chart of GBPUSD, after the pair had fallen from 1.3000 to 1.2600 over two weeks, a 400-pip decline, so rule 1 was satisfied before candle 1 even printed. I was not looking for a long. I was watching the decline, waiting for it to end, and the three-river bottom is what an ending decline looks like when it is honest about it.
| Candle | Open | High | Low | Close | Body | What it showed |
|---|---|---|---|---|---|---|
| Candle 1 | 1.2720 | 1.2730 | 1.2620 | 1.2630 | 90 pips black | Strong decline, sellers in charge |
| Candle 2 | 1.2680 | 1.2690 | 1.2540 | 1.2650 | 30 pips black, 110-pip shadow | Body inside candle 1, new low tested and pushed back |
| Candle 3 | 1.2630 | 1.2660 | 1.2580 | 1.2640 | 10 pips white | Quiet session, low held, closed below candle 2’s close |
| Confirmation | 1.2640 | 1.2710 | 1.2620 | 1.2700 | 60 pips white | Closed above candle 2’s high of 1.2690 |
Candle 2 is the one that changed my mind. It opened at 1.2680, inside candle 1’s body of 1.2630 to 1.2720, traded down to 1.2540, a new low 80 pips below candle 1’s low, and only closed at 1.2650 because buyers stepped in at the low. The shadow is 110 pips against a 30-pip body, more than three times the body, so rule 3 passes. Candle 3 opened at 1.2630, stayed above the low, and closed at 1.2640, below candle 2’s close of 1.2650, so rule 4 passes. The confirmation candle closed at 1.2700, above candle 2’s high of 1.2690, so rule 5 passes. I entered long at 1.2710, 10 pips above the confirmation close, with the stop at 1.2530, 10 pips below the pattern low of 1.2540. The stop distance is 180 pips, so the size is 0.27 lots and the actual risk is $486.
| Leg | Price | Distance | Lots | Result |
|---|---|---|---|---|
| Entry long | 1.2710 | — | 0.27 | — |
| Stop loss | 1.2530 | 180 pips | 0.27 | Minus $486 if hit |
| Take profit 1 | 1.2890 | 180 pips | 0.135 | Plus $243 |
| Take profit 2 | 1.3070 | 360 pips | 0.135 | Plus $486 |
| Total | — | — | — | Plus $729, or 1.5R |
Price rose to 1.2890 two sessions later, and I took half off for plus $243. It reached 1.3070 the following week, and I took the rest off for plus $486. The total was plus $729, or 1.5 times my risk. The trade worked because I waited for the confirmation candle. If I had bought candle 3, when it looked like a bottom, my stop would have been below the same low, my entry would have been 1.2640, and the confirmation candle’s dip to 1.2620 would have been a drawdown I had to sit through instead of a confirmation I traded after. Waiting for the confirmation cost me 70 pips of entry price and saved me the entire trade.
The fourteen-trade test: confirmation versus blind reversal
I tested the unique three river bottom over fourteen strict-rule trades and sixteen blind trades, and the difference is the whole argument for the rules. The strict set required all six rules, including the confirmation close, plus a London or New York session and no red-folder news within one hour either side. The blind set was the textbook version: buy the close of the third candle, same instrument, same risk per trade, same targets, no confirmation. The strict set made money. The blind set gave it back, which is exactly what Bulkowski’s 60 percent continuation figure predicts.
| Set | Trades | Wins | Losses | Net in R | Net in dollars | Best win |
|---|---|---|---|---|---|---|
| Strict, all six rules | 14 | 8 | 6 | Plus 5.0R | Plus $2,500 | $729, 29.2% of net |
| Blind, buy candle 3 | 16 | 5 | 11 | Minus 4.5R | Minus $2,250 | $750, not meaningful |
| Filter worth | — | — | — | 9.5R | $4,750 | — |
The strict wins break down as six full winners at 1.5R each and two partial winners at 1R each, which is 11R of wins against 6R of losses, a net of plus 5R. The blind set had three full winners at 1.5R and two partial winners at 1R, which is 6.5R of wins against 11R of losses, a net of minus 4.5R. The filter is worth 9.5R, or $4,750, at $500 of risk per trade. The best strict win was $729, which is 29.2% of the $2,500 net, inside my firm’s 30% consistency ceiling. The five-trade slice from the strict set tells the same story in miniature: plus $729, minus $486, plus $729, plus $243, plus $729, which is plus $1,944, or 4.0 times the risk. The pattern is not the edge. The confirmation around the pattern is the edge. My trend pullback guide shows the same lesson on a continuation pattern: the filter, not the shape, decides whether the account survives.
Session and news filters
A three-river bottom that confirms in the dead hours is a different pattern from one that confirms in London or New York. The confirmation candle needs real volume behind it, because a close above the second candle’s high on thin volume is just a spread narrowing, not buyers taking control. I only trade three-river bottoms whose confirmation candle closes during the London session, 08:00 to 11:00, or the New York session, 13:30 to 16:00. A confirmation that closes at 03:00 in the Asian session does not count, no matter how perfect the first three candles look. I also skip any pattern whose confirmation candle closes within one hour of a red-folder news event on either currency in the pair. News can print a perfect confirmation and then erase it in one candle, and no sizing maths survives a 100-pip news spike against a 180-pip stop.
| Session | Window | Trade it? | Why |
|---|---|---|---|
| Asian | 00:00 to 07:00 | No | Thin volume; the confirmation close is often just spread |
| London | 08:00 to 11:00 | Yes, my first choice | Real volume, clean closes, best follow-through |
| New York | 13:30 to 16:00 | Yes | Second wave of volume, good for dollar pairs |
| Red-folder news | One hour either side | No | News prints perfect confirmations and then erases them |
| Friday close | After 16:00 Friday | No | Weekend gap risk turns a 180-pip stop into a guess |
When the pattern fails
The unique three river bottom fails in four ways, and I have paid for all four. The first is the continuation break: the third candle closes, and the next candle closes below the second candle’s low. That is Bulkowski’s 60 percent case, and it is not a failed trade, it is a pattern that never became a trade, because rule 5 kept me out. The second is the false confirmation: a candle closes above the second candle’s high, I enter, and the next candle closes straight back below the pattern low. The stop is the exit, and the loss is $486. The third is the shallow second candle: its shadow is shorter than twice its body, so the low was never really tested, and the third candle is just a pause in the decline. The fourth is the news reversal: a red-folder release prints a perfect confirmation candle, then the news turns out to be a non-event, and price gives the whole move back in an hour.
| Failure | What it looks like | What I do |
|---|---|---|
| Continuation break | A candle closes below candle 2’s low before any confirmation | No trade at all; the pattern is dead, Bulkowski was right |
| False confirmation | Confirmation closes, then price closes below the pattern low | Exit at the stop, no re-entry on the same structure |
| Shallow second candle | Shadow shorter than twice the body | Rule 3 already filters this; skip it before it starts |
| Range bottom, not a trend bottom | Decline under 200 pips before candle 1 | Rule 1 already filters this; skip it before it starts |
| News reversal | Perfect confirmation, then a 100-pip give-back in one candle | News filter already skips it; if caught, exit at the stop |
| Third candle turns strong | Third candle closes above candle 1’s high | That is a three inside up, not a three-river bottom; trade it by those rules instead |
The sixth failure is the one I watch for most carefully, because it looks like a three-river bottom right up until it is not. If the third candle is strong instead of small, closing above the first candle’s high, the pattern is a three inside up, and trading it by three-river rules means waiting for a confirmation that already happened. The two patterns share the first two candles, and only the third candle tells them apart. Three candles that almost form a pattern are not a pattern. They are a warning to check which pattern you are actually looking at.
Mistakes I made with three-river bottoms
The first mistake is the one this article opens with: buying the third candle. The textbook calls the pattern a bullish reversal, and the third candle looks like the bottom, so buying it feels like the trade. It is not. It is a quiet session after a tested low, and Bulkowski’s data says the decline continues 60 percent of the time from there. I lost $500 learning that, and I have never bought a third candle since. The second mistake is entering while the confirmation candle is still forming. A white confirmation candle that is still forming can turn into a doji, a hammer, or a small black candle, and every one of those kills the confirmation. I lost $390 entering a forming confirmation that closed as a doji, then watched price break the low and run 120 pips through my stop.
The third mistake is trading the pattern in a range. A three-candle shape inside a 100-pip range is not a reversal, it is noise with a nice outline, and the stop below the pattern low is a magnet for a range breakdown that stops you out and then comes back. The fourth mistake is sizing for the pattern instead of the stop. A 180-pip stop at full size is a $1,800 risk on a $500 budget, and I have seen traders do exactly that because the confirmation looked certain. Certainty is not a sizing input. The fifth mistake is adding to the long when price dips after the confirmation. A dip to the entry is normal, and adding there doubles the loss if the confirmation was false. My advance block guide covers a three-candle top with the same discipline: one pattern, one trade, no add-ons. The sixth mistake is the simplest: forgetting the pattern is rare. If you think you see three three-river bottoms a week, you are seeing homing pigeons and small white candles, and you are about to trade a two-candle pattern as if it were a three-candle one. Log every candidate you mark and count them weekly.
How the three-river bottom fits prop firm rules
The three-river bottom fits prop firm rules because its weakness is also its strength: the stop is wide, so the position is small, and a small position is the easiest way to respect a daily loss limit. A 0.27-lot long with a 180-pip stop risks $486, which is under 10% of my $5,000 daily limit. Even if the confirmation was false and the stop is hit, I have $4,514 of daily limit left, and the day is not over. Compare that with a 1-lot long on a 50-pip stop, which risks the same $500 but leaves the account exposed to a single news candle. The three-river bottom’s wide stop is honest about the risk, and honesty is what keeps a funded account alive.
The trailing drawdown rule is the second fit. Most firms trail the maximum drawdown behind your highest equity, so a winning streak followed by a give-back can breach the rule even while you are still profitable overall. The three-river bottom’s first target at 1R is my defence against that give-back: I take half the position off at 1R, move the stop to breakeven, and let the rest run to 2R. The consistency rule is the third fit: my best day in the strict fourteen-trade test was $729, which is 29.2% of the $2,500 net, inside the 30% ceiling, and it only stayed inside because the confirmation filter removed the wild counter-trend trades that produce single huge wins and single huge losses. The three-river bottom does not make you profitable by finding better bottoms; it makes you fundable by keeping every bottom inside the rules. If you want the same discipline on a bullish mirror of a different shape, my ladder bottom guide shows a five-candle bottom with the same one-trade, fixed-risk approach.
My daily three-river routine
My routine takes ten minutes before the London open and it never changes. I scan the daily charts of the pairs I trade, and I look for a long black candle at the end of a decline. If I find one, I check the next candle: body inside the first, shadow twice the body, new low. If that passes, I mark the chart and I wait for the third candle. If the third candle is small and white and stays above the low, I set an alert for a close above the second candle’s high. If the confirmation closes, I check the session, check the news calendar, run the sizing grid, and enter 10 pips above the close. If any step fails, I delete the alert and move on. Most days there is no three-river bottom, and that is fine. A rare pattern traded rarely is an edge. A rare pattern traded often is a habit.
| Time | Check | Decision |
|---|---|---|
| 07:00 | Daily charts for a long black candle after a decline | Mark any decline of 200 pips or more |
| 07:03 | Second candle shadow check | Shadow twice the body and a new low, or delete the mark |
| 07:05 | Third candle check | Small white candle, low above candle 2’s low, or delete the mark |
| 07:07 | Session and news calendar | London or New York only, no red-folder news |
| At the close | Confirmation close above candle 2’s high | All six rules, sizing grid, drawdown check, then enter |
| After the trade | Log the three candles and the result | Review every Friday, count how many were ranges |
The last row is the one most traders skip, and it is the one that made the difference for me. I log every three-river bottom I mark, whether I trade it or not, and every Friday I count how many of the untraded ones were in ranges. The count is usually higher than I expect, and that is the point: the pattern is rare, and most of what looks like it is not it. An indicator you do not review is decoration. A pattern you do not count is a superstition. Count it weekly, and it becomes an edge.
Frequently asked questions
What is a unique three river bottom in simple terms?
It is a three-candle bullish reversal at the end of a downtrend. The first candle is a long black candle. The second is a black candle whose body sits inside the first candle’s body, with a long lower shadow that makes a new low. The third is a small white candle that closes below the second candle’s close and stays above the second candle’s low. The pattern only becomes a trade after a later candle closes above the second candle’s high.
Is the unique three river bottom actually a reliable reversal?
Not on its own. Bulkowski tested it across more than 4.7 million candle lines and found it acts as a bearish continuation 60 percent of the time, with a frequency rank of 89 out of 103 patterns and an overall performance rank of 60 out of 103. The textbook calls it a reversal, but the data says buying the third candle loses more often than it wins. I only trade it with a confirmation close above the second candle’s high, and my fourteen-trade test shows the confirmation filter is worth $4,750 against the blind textbook version.
How is it different from a homing pigeon?
A homing pigeon is the first two candles of a three-river bottom: a long black candle followed by a smaller black candle whose body sits inside the first. The three-river bottom adds the second candle’s new-low shadow and a third, small white candle that stays above that low. The homing pigeon is a weaker, earlier signal. If you trade the first two candles as a homing pigeon, you are trading before the low has been tested by a third session.
Where do I put the stop loss on a three-river bottom?
Ten pips below the pattern low, which is the lowest point of candles one to three, usually the second candle’s low. On my GBPUSD worked trade the pattern low was 1.2540 and the stop was 1.2530, a 180-pip stop. That is wide, so the position is small: 0.27 lots for a $486 risk. Never tighten the stop to fit a bigger size, because the wide stop is what keeps the trade alive through normal volatility.
Can I trade it on the four-hour chart?
Yes, but the rules change. On the four-hour chart the decline only needs to be 100 pips, the first candle’s body only needs to be 30 pips, and the stop will be narrower, around 80 to 100 pips, with a bigger position, around 0.5 to 0.62 lots for the same $500 risk. What does not change is the confirmation rule: never trade it before a candle closes above the second candle’s high, and never trade it outside the London or New York session.
How often does a unique three river bottom appear?
Rarely, and that is the point. Bulkowski found only 80 clean examples in more than 4.7 million candle lines, and on the daily chart across the five pairs I watch, I see a clean one about once every three to four weeks. Most weeks there is nothing to trade, and that is fine. A rare pattern traded rarely is an edge. If you think you see three three-river bottoms a week, you are almost certainly looking at homing pigeons and small white candles, and you are about to trade a two-candle pattern as if it were a three-candle one. Log every candidate you mark and count them weekly.
Risk disclaimer: Trading leveraged products on a funded or evaluation account can result in the loss of your challenge fee and account. This article is educational, based on my own demo and funded-account experience, and is not financial advice. Always confirm your firm’s exact drawdown, consistency and daily loss rules before trading, and never risk money you cannot afford to lose.



