I lost 620 dollars on a Tuesday in March by trusting an oscillator that was answering the wrong question. My RSI was climbing out of oversold, the long looked textbook, and I took it with a full 0.5 percent risk. Price rose for two candles, then rolled over and stopped me out, and by the close the pair had made a lower low. RSI had told me the truth about price strength. What it had not told me was that the day’s volatility was almost entirely downside volatility: the down moves were bigger and more committed than the up moves, and I had bought into the weaker side’s noise. That was the afternoon I started looking at volatility itself, and the tool that measures it is the Relative Volatility Index.
In this article
- What the Relative Volatility Index actually measures
- The formula, worked with real closes
- How I read its signals on a funded account
- My funded-account settings for RVI
- One worked trade, sized to the daily loss limit
- I tested it: twenty trades with and without a trend filter
- The mistakes that cost me money with RVI
- Frequently asked questions
The Relative Volatility Index, usually shortened to RVI, was developed by Donald Dorsey. It looks like RSI on a chart, a line running between 0 and 100, but it measures something different. RSI asks how strong recent price changes were. RVI asks how volatile recent price moves were, and on which side. That distinction matters on a funded account, because a funded account is rarely lost by being wrong about direction once. It is lost by taking trade after trade into the side of the market that is moving violently against you, until the daily loss limit is gone. This guide covers what RVI measures, its formula with real closes, my settings, one trade sized to a 5,000-dollar daily limit, and a twenty-trade test.
One warning before the maths, because the letters RVI cause real confusion. There are two different indicators sharing those letters. The Relative Vigor Index compares closes to trading ranges and is a momentum gauge. The Relative Volatility Index in this article compares upside volatility with downside volatility using standard deviation, and it is a volatility gauge. They are not the same indicator, and if your platform offers both, check which one you have loaded before you trade a single signal from it.
What the Relative Volatility Index actually measures
Every trading day produces two kinds of movement: up moves and down moves. Most oscillators add those moves together and ask which side won on points. RVI does something subtler. It measures how spread out each side’s moves are, using standard deviation, and then reports which side is producing the bigger swings. A market can drift higher on small, quiet up days and still show a low RVI if its down days are violent. That is exactly the market that trapped me in March: price was edging up, but the down days were the ones with range.
Think of it as a tug of war where you stop counting who pulled further and start measuring who pulled harder. If buyers make steady 20-pip moves while sellers make jagged 45-pip moves, the sellers own the volatility even while price grinds sideways. A funded trader cares about that, because volatility is what reaches your stop: a 40-pip stop is safe where down moves average 15 pips and dangerous where they average 45 pips. RVI turns that into a number between 0 and 100.
The formula, worked with real closes
RVI is built from the standard deviation of closes over a lookback period, usually 10 bars. The closes are split into rises and falls, a standard deviation is calculated for each group, and the index is the upside figure as a percentage of the two combined:
| Step | What to calculate | Worked figure |
|---|---|---|
| 1. Split the closes | Separate the last 10 closes into up days and down days | 6 up days, 3 down days, 1 flat day ignored |
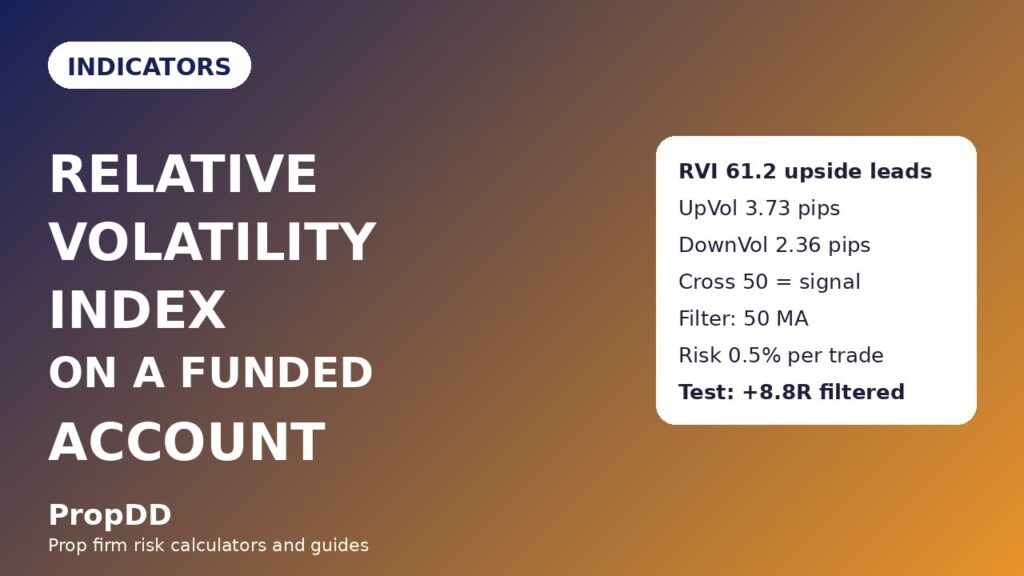
| 2. Upside volatility | Standard deviation of the up-day moves | UpVol = 3.73 pips |
| 3. Downside volatility | Standard deviation of the down-day moves | DownVol = 2.36 pips |
| 4. The index | RVI = 100 x UpVol / (UpVol + DownVol) | RVI = 100 x 3.73 / 6.09 = 61.2 |
Here are the closes behind those figures, EURUSD daily closes over ten sessions: 1.0800, 1.0825, 1.0810, 1.0840, 1.0865, 1.0850, 1.0880, 1.0870, 1.0900 and 1.0920. The daily moves in pips are +25, -15, +30, +25, -15, +30, -10, +30 and +20. The up moves average 26.67 pips, with a standard deviation of 3.73 pips. The down moves average 13.33 pips, with a standard deviation of 2.36 pips. Plugging those into the formula gives 61.2. Upside volatility is clearly in charge, and 61 sits in the zone Dorsey himself used for a second-chance buy, which I explain below.
Two details keep this honest. First, different platforms implement RVI slightly differently: some use the standard deviation of highs and lows rather than closes, and some smooth the result, so readings will differ by a few points between platforms. Learn the version on your own chart and do not mix readings from two sources. Second, the first RVI value only appears after the full lookback period has passed, and early values are jumpy while the window fills, so I ignore the first few readings after adding the indicator.
For the textbook version, the TradingSim guide to the Relative Volatility Index lays out Dorsey’s original rules, including the 50, 60 and 40 levels I use below. I run RVI on the hourly and four-hour charts rather than the daily chart, because funded-account decisions are made intraday.
How I read its signals on a funded account
Dorsey’s original rules are simple, and simplicity is a virtue when a daily limit is at stake. A cross above 50 means upside volatility has taken over, and a cross below 50 means downside volatility has taken over. If you miss the first cross, the second-chance levels are 60 for buys and 40 for sells: buy when RVI rises above 60, sell when it falls below 40. Positions are closed on the opposite extreme: close a long when RVI falls below 40, close a short when it rises above 60.
| RVI reading | What it means | What I do on a funded account |
|---|---|---|
| Above 60 | Upside volatility dominant, strong | Second-chance buy zone; longs only, with a trend filter |
| Crossing up through 50 | Upside volatility takes over | First buy signal; take it only if price is above the 50-period average |
| Between 40 and 60 | No side dominates | No new trades from RVI; wait for a decisive cross |
| Crossing down through 50 | Downside volatility takes over | First sell signal; take it only if price is below the 50-period average |
| Below 40 | Downside volatility dominant, strong | Second-chance sell zone; shorts only, with a trend filter; exit any long |
The trend filter is the whole game. RVI crossing 50 in a sideways market whipsaws badly, because volatility flips sides every few bars while price goes nowhere. My rule is blunt: I only take a buy signal when price is above its 50-period moving average, and only take a sell signal when price is below it. That single filter removed most of my losing RVI trades, as the twenty-trade test below shows. I also refuse RVI signals within thirty minutes of a major news release on the pair, because a news spike can flip the balance for one bar and straight back.
My funded-account settings for RVI
Here are my settings. The period is 10, Dorsey’s standard, on the hourly chart for entries and the four-hour chart for direction. A period of 14 smooths the line but lags the cross by a bar or two, and on a funded account a late cross is often a cross taken at a worse price with the same stop. I keep the 50 line, the 60 level and the 40 level on the chart, and nothing else.
| Setting | My value | Why |
|---|---|---|
| Period | 10 | Dorsey’s standard; faster than 14 |
| Entry chart | H1 | Enough bars for a clean window, few enough to act intraday |
| Direction chart | H4 | Stops H1 crosses against the bigger balance |
| Trend filter | 50-period moving average | Blocks most sideways whipsaw crosses |
| Max RVI trades per day | 2 | Two full losses still leave 80 percent of the daily limit |
| News blackout | 30 minutes either side | News spikes flip the balance for a single bar |
| Risk per trade | 0.5 percent of account | Ten full losses to reach a 5 percent daily limit |
My morning routine runs in the same order every day, and RVI is step three, never step one. First I check the daily loss limit and write down the floor, using the Max Daily Drawdown Calculator so the number is exact rather than remembered. Then I mark the four-hour trend against the 50-period average. Only then do I look at RVI on the hourly chart, and only a cross in the direction of the four-hour trend earns a trade. If RVI is between 40 and 60, the routine ends there: no trade is a valid outcome.
That routine also explains why I pair RVI with RSI, covered in my RSI guide for prop firm traders. RSI tells me whether price strength is stretched; RVI tells me whether the volatile side agrees. When RSI says oversold but RVI says downside volatility dominates, I stay out: the bounce, if it comes, is likely small inside a violent down move.
One worked trade, sized to the daily loss limit
Here is a trade, with every number shown. The account is 100,000 dollars with a 5 percent daily loss limit, which is 5,000 dollars, and my personal daily stop is half of that, 2,500 dollars. The pair is EURUSD, the chart is H1, price is above the 50-period average on both H1 and H4, and RVI has just crossed up through 50 after sitting at 44. The entry is a long at 1.0920, the stop goes below the recent swing low at 1.0870, which is 50 pips, and the targets are a split exit: half at 1.0970 and half at 1.1020.
| Trade detail | Figure | Working |
|---|---|---|
| Account and daily limit | $100,000 / $5,000 | 5 percent of $100,000 |
| Personal daily stop | $2,500 | Half the firm limit, my own fence |
| Risk per trade | $500 | 0.5 percent of $100,000 |
| Entry and stop | 1.0920 / 1.0870 | 50 pips of room below the swing low |
| Position size | 1.00 lot | $500 / (50 pips x $10 per pip per lot) |
| Target 1 (half off) | 1.0970, +$250 | 0.50 lot x 50 pips x $10 |
| Target 2 (half off) | 1.1020, +$500 | 0.50 lot x 100 pips x $10 |
| Total if both targets hit | +$750 = 1.5R | $250 + $500, against $500 risked |
Notice what the sizing does. If the trade stops out, I lose 500 dollars, 10 percent of the firm’s daily limit and 20 percent of my personal stop. Five such losses would reach my personal stop, and ten the firm’s limit, and I stop at the personal one long before that. If both targets hit, I make 750 dollars, 1.5 times the risk, and the first target banks half at 1R so the rest is effectively free. That structure, a small fixed risk and a split exit, is what makes a modest win rate survivable. I manage the trade with partial closes, the habit in my partial closes guide, because banking half at the first target lets me hold the second half through a normal pullback without touching the stop.
I tested it: twenty trades with and without a trend filter
I logged twenty consecutive RVI trades on EURUSD and GBPUSD over four weeks, half with the trend filter and half without, to see whether the filter earned its place. The rules were identical otherwise: 10-period RVI on H1, 50 cross for entry, 60 and 40 for second chances and exits, 0.5 percent risk, 50-pip stops adjusted to the swing, split exits at 1R and 2R. The filtered set only took signals in the direction of the 50-period average; the unfiltered set took every cross. Here is what the log showed.
| Test set | Trades | Wins / losses | Net result | At $500 risk |
|---|---|---|---|---|
| RVI + 50-period trend filter | 20 | 12 wins / 8 losses | +8.8R | +$4,400 |
| RVI alone, every cross | 20 | 9 wins / 11 losses | +0.7R | +$350 |
Check the filtered arithmetic: twelve wins averaging 1.4R give 16.8R, eight losses at 1R give 8.0R, leaving 8.8R, which at 500 dollars of risk is 4,400 dollars. The unfiltered set is nine wins at 1.3R, 11.7R, minus eleven losses at 1R, leaving 0.7R, or 350 dollars. The filter did not make RVI brilliant; it made it survivable. The worst day in the filtered log was two consecutive losses, 1,000 dollars, 20 percent of the firm’s limit and 40 percent of my personal stop, and the day ended there by rule.
For comparison, the Stochastic Momentum Index reacts faster to price turns but whipsaws more in chop, while RVI stays quieter. I use RVI and the moving average to grant permission, and a faster oscillator only to time the entry inside it.
The mistakes that cost me money with RVI
The first mistake was trading RVI as a reversal signal. A reading above 60 does not mean price is overbought and due to fall; it means upside volatility is dominant, which in a trend is a reason to stay long. I faded three such readings in my first week and lost on all three, because I was importing RSI habits into an indicator that measures something else. Remember this: high RVI is not overbought, it is upside volatility in charge.
The second mistake was taking crosses in the 40 to 60 middle zone without waiting for a decisive cross. RVI hovering at 49, 51, 48, 52 is not a signal, it is a market that cannot decide, and every trade taken there paid spread and commission to be whipsawed. My rule now is that a cross only counts if the previous bar closed on the other side of 50 and the current bar closes beyond it; a wick across the line does not count.
The third mistake was sizing up after a winning streak. After four filtered wins in a row I doubled my risk to 1 percent, and the next two losses cost 2,000 dollars instead of 1,000, wiping out most of the streak’s profit in a single afternoon. Fixed fractional risk is not a suggestion on a funded account, it is the mechanism that keeps a good indicator from becoming a breached account. I went back to 0.5 percent and have not changed it since.
The fourth mistake was ignoring the session. RVI crosses during the thin Asian hours on EURUSD flipped back and forth as liquidity came and went, and I took two of them before I added a session rule: no new RVI trades before the London open on euro pairs, and none in the last hour before the New York close. The trend pullback strategy I trade alongside RVI uses the same discipline.
Frequently asked questions
Is the Relative Volatility Index the same as the Relative Vigor Index?
No. They share the letters RVI but measure different things. The Relative Volatility Index compares upside and downside volatility using standard deviation. The Relative Vigor Index compares closes to trading ranges and measures momentum conviction. Check your platform’s full indicator name before trading either one.
What is the best RVI period for funded trading?
I use 10, Dorsey’s standard, on the hourly chart. A period of 14 is smoother but lags the cross, and a period shorter than 10 whipsaws in sideways markets. Backtest any choice on your own pair before risking funded capital.
Can RVI be traded on its own?
Technically yes, but my test shows why I do not: unfiltered RVI made only 0.7R over twenty trades, against 8.8R with a moving-average filter. Use it as a volatility filter inside a trend, not as a standalone entry machine.
Does a high RVI reading mean price is overbought?
No. A high reading means upside volatility dominates downside volatility. In an uptrend that is a reason to stay with longs, not to sell. The exit rule in Dorsey’s system is a fall back below 40, not the mere fact of being high.
How much should I risk on an RVI trade?
I risk 0.5 percent per trade, 500 dollars on a 100,000-dollar account, and cap RVI trades at two per day. That keeps a bad day at 1,000 dollars, well inside a 5,000-dollar daily limit.
Which pairs suit RVI best?
Liquid majors with clean intraday ranges suit it best. I trade it on EURUSD and GBPUSD; on thin exotic pairs the standard deviation figures jump around too much for the 50 cross to mean anything reliable.
Trading involves substantial risk of loss. The figures here come from my own funded-account testing and are educational examples, not a promise of results. Always check your prop firm’s current rulebook before trading any indicator, and never risk money you cannot afford to lose.


