The dashboard is the scoreboard that decides whether your account lives. It’s also, for many new prop traders, a slightly confusing screen full of percentages, bars and labels that don’t always match the numbers on the trading platform. Learning to read it properly takes about ten minutes and prevents a surprising number of “but my platform said I was fine” moments.
In this article
- Balance and equity
- Profit target progress
- The daily loss meter
- The max loss meter
- Trading days, status and other fields
- Why the dashboard and your platform can disagree
- How to reconcile the two, step by step
- A worked example
- Screenshots as evidence
- The mobile app and notifications
- Make the dashboard part of your routine
- Mistakes to avoid
- Reading percentages versus dollars
- What a good dashboard habit looks like in practice
- What to do if something looks wrong
- Using the dashboard to spot your own patterns
- Mismatches after payouts, scaling and changes
- A five-minute dashboard audit for a new account
- Why this matters more than it seems
- When the dashboard shows a warning
- Frequently asked questions
- The short version
Every firm lays its dashboard out differently, so this guide describes the items you’ll typically meet and how to check each one, without claiming to describe any particular firm. The principle is the same everywhere: the dashboard is the judge, your platform is your working tool, and you should know exactly how the two relate. The drawdown calculator lets you reproduce the key figures by hand.
Balance and equity
Balance is the money in the account from closed trades. Equity is balance plus the floating profit or loss of open trades. Many dashboards show both. If your equity is lower than your balance, you have floating losses. Most daily loss rules at prop firms use equity, so the equity figure on the dashboard is the one to watch, not the balance. The difference is explained in balance-based versus equity-based daily drawdown.
Profit target progress
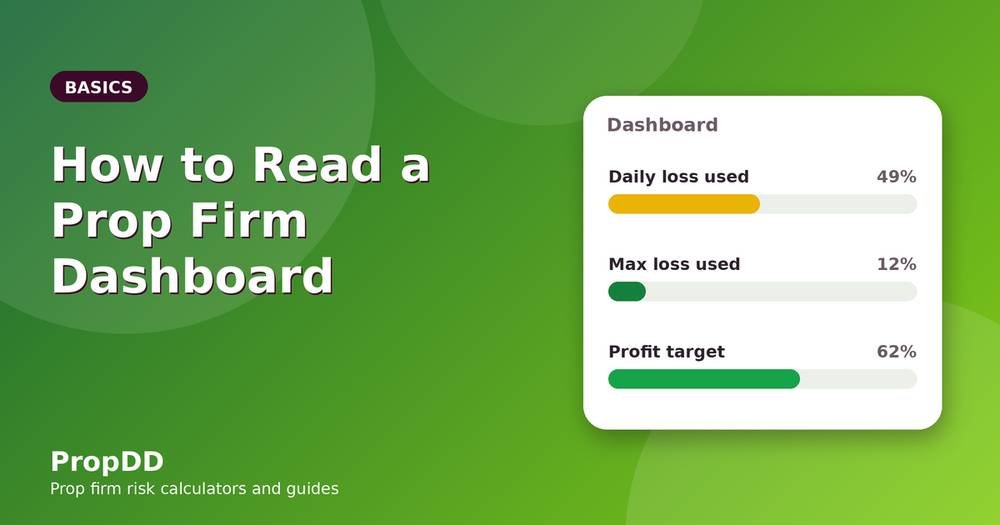
Usually a bar or a percentage showing how far you are toward the target. Check how it’s calculated: from the initial balance, from the current balance, from equity or from closed profit only. If your own sheet says you’re at 5.2% and the dashboard says 4.9%, the gap often comes from costs, floating positions or rounding. Find the cause once, and you’ll trust the number afterwards.
The daily loss meter
This is the figure that matters most day to day. It usually shows how much of the daily limit you’ve used, how much remains, or both, and sometimes it shows the equity level at which you’d breach. Ask yourself three things about it. What is it measured from: the initial balance, or start-of-day balance or equity? When does it reset, and in what time zone? Does it include floating profit and loss and costs? Your rulebook answers these, and the meter should agree with it. If it doesn’t, ask support. The calculation is in how to calculate max daily loss.
The max loss meter
The overall limit usually has its own bar. Look for whether it’s static or trailing: a trailing floor moves up as your highest balance or equity rises, and the dashboard may show the current floor as a number. Note the floor in your notes each day, because the cushion can shrink even when you’re in profit. The types are explained in static versus trailing drawdown, and how the two limits interact in daily versus overall drawdown.
Trading days, status and other fields
Most dashboards count the number of trading days, show whether the account is active, and list rule status or violations. Check what counts as a trading day, since firms define it in different ways (a trade opened, a minimum size or a minimum profit or loss). Make a habit of reading the status field after every session. If a rule warning appears there, you want to see it the same hour, not the next week.
Why the dashboard and your platform can disagree
There are a few common reasons. Update delay: dashboards often refresh every few seconds or minutes, so a fast move can show up late. Costs: commissions and swaps may be included in one and delayed in the other. Time zone: the day boundary on the dashboard may follow the firm’s server clock. Definition: the dashboard might use a different base for the daily limit than the one you used. Rounding: percentages displayed to one decimal place can hide small differences. None of these means the numbers are wrong. It means you need to know which one counts.
How to reconcile the two, step by step
- At the start of the day, note your start-of-day equity on both the platform and the dashboard.
- Calculate your floor by hand from the rulebook (start-of-day figure minus the max daily loss).
- Compare it with the number the dashboard shows. If they match, you’re aligned.
- After one or two trades, compare equity on both screens, with the time visible.
- If the difference is more than a few dollars, screenshot both and ask support which figure the rule uses.
It takes five minutes on the first day and almost none afterwards. It also builds a record you can show support if something ever goes wrong.
A worked example
A trader has a $100,000 account with a 5% daily limit on start-of-day equity. Start-of-day equity is $101,200, so the limit is $5,060 and the floor is $96,140. Mid-session, the platform shows equity of $98,700. The dashboard shows the daily loss used as 49.4%. Check: $101,200 minus $98,700 is $2,500, and $2,500 divided by $5,060 is 49.4%. They agree. If the dashboard had shown 41%, the trader would suspect that it measures from the initial $100,000 or ignores floating losses, and would ask. Neither outcome is a problem as long as you check early.
Screenshots as evidence
Take a screenshot of the dashboard at the reset time, after any large loss, before and after a payout and whenever something looks odd. Include the time. Store them in a folder by month. Screenshots are the cheapest insurance in trading: they cost seconds, and they turn a “he said, she said” situation with support into a factual one.
The mobile app and notifications
Some firms have a mobile view of the dashboard or send alerts near the limit. If yours does, switch the alerts on, but don’t rely on them. Your own alert on equity at your personal stop level is the first line of defence; the firm’s warning, if any, comes much closer to the wall. See how to set a personal daily stop.
Make the dashboard part of your routine
Before the session: open the dashboard, note the figures and compare with your floor. During the session: check it after each trade, especially if you hold positions. After the session: record the daily limit used in your trading journal. A dashboard you only open after something goes wrong is just an obituary. Used before and during the day, it’s a dashboard in the proper sense.
Mistakes to avoid
Trusting the platform over the dashboard when they disagree. Reading the daily loss meter without knowing what it’s measured from. Ignoring the max loss floor while watching only the daily bar. Never checking the reset time. Not taking screenshots. Assuming a rule is satisfied because no warning has appeared.
Reading percentages versus dollars
Dashboards often show the daily and overall limits as percentages. Convert them to dollars once, and keep both in your notes. “Used 62%” sounds abstract, while “I’ve lost $3,100 of a $5,000 limit and have $1,900 left” is much easier to act on, and it translates directly into how many more trades you can afford. The calculator on the home page makes this conversion for you, including the number of full-size losses you can still absorb.
What a good dashboard habit looks like in practice
Consider two traders. The first only opens the dashboard when the account is in trouble, usually after a bad run. The second opens it at the start of every session, compares the daily floor with their own calculation and glances at it after every trade. The second trader notices a mismatch on the first day, asks support, and trades the rest of the challenge with the right numbers. The first discovers a misunderstanding at the worst possible moment. The difference isn’t intelligence, it’s a habit that takes seconds.
What to do if something looks wrong
If the numbers don’t make sense, stop trading and sort it out. Screenshot the dashboard and the platform with the time visible, write down what you expected and what you see, and send support a short, specific message with the screenshots attached. Ask which figure the rule uses and how it is calculated. Keep working on nothing else until you have an answer, because trading with an unknown limit is the opposite of risk management.
Using the dashboard to spot your own patterns
The history of daily loss bars is a quiet mirror. If you notice that most of your days finish above half the limit, your risk is probably too big. If your worst days cluster around news releases or the first hour of a session, you’ve found a pattern you can plan around. Many firms let you view past days; if yours does, scroll back once a week and add a line to your journal. The dashboard is more than a rule engine; it’s a record of how you actually trade.
Mismatches after payouts, scaling and changes
Dashboards can behave differently right after a payout, a scaling step or a rule change. The balance changes, the floor may re-base and the daily base may shift. Check everything on the first day afterwards, and again compare with your own calculation. These are the days when mismatches are most likely, and the days when a misunderstanding costs the most. Details on how withdrawals interact with limits are in prop firm payout rules and drawdown.
A five-minute dashboard audit for a new account
On the first day of a new account, spend five minutes on this audit. List every figure on the dashboard. Write next to each what it measures, using the rulebook. Calculate your daily floor and overall floor by hand and compare them with what’s shown. Note the reset time in your own time zone and watch the daily meter when it passes. Place one tiny trade and watch how fast the dashboard updates. Finally, write down anything you couldn’t explain and ask support in one message. That small audit often reveals one surprise, and you’d much rather find it with a tiny trade than with a large one.
Why this matters more than it seems
Most breaches aren’t caused by traders who don’t know the rules. They happen to traders who know the rules in general but not how this particular dashboard applies them. The number on the screen is the number the firm acts on, and the best time to understand it is before the first real trade. It’s a modest investment with a large return.
When the dashboard shows a warning
Some dashboards flag a rule warning or a near-breach state. Treat it as a hard stop, not as advice. Close what’s open, step away and find out exactly what triggered it before you trade again. A warning is the firm telling you that the numbers have moved faster than you thought, and the cheapest response is always to reduce exposure first and investigate second.
Afterwards, write the cause in your journal, whether it was a news spike, an oversized trade or a misread rule. Over time, the warnings become a short list of habits to change.
Frequently asked questions
Which is right, my platform or the dashboard?
The dashboard is usually the firm’s official record. Confirm with support which figure the rule uses, and keep their answer.
Why is my daily loss bar higher than I expected?
Often floating losses, commissions or a different base. Reconcile it by hand using the rulebook definition.
How often does the dashboard update?
It varies. If you’re close to a limit, don’t rely on it being instant; rely on your own equity alert.
Does the dashboard show my floor?
Many do, as a number or a bar. If yours doesn’t, calculate it yourself and keep it in your daily notes.
The short version
Know what balance, equity, the daily loss meter and the max loss meter each measure, reconcile them with your platform on day one, and take screenshots. For the rules those figures come from, read the prop firm max daily drawdown explained, and for neutral background on the terms, Investopedia’s page on drawdown and the free lessons at BabyPips are good references.