The trade that taught me to respect the Commodity Channel Index did not look dramatic on the chart. It was a Wednesday afternoon on a $100,000 funded account, EURUSD drifting sideways in a 25-pip band, and the CCI on my 15-minute chart sat at -134. Oversold, the textbooks said. I bought it. The CCI dropped to -220, bounced to +40, then fell again — and I was stopped at my daily loss limit before the pair ever turned. The problem was not that the indicator was wrong. It was that I had used an unbounded oscillator the way I used bounded ones, and on a funded account that distinction costs real money. This guide is everything I wish I had known about the CCI for prop firm traders: what it actually measures, the formula, which settings keep you inside the rules, the three signals worth taking, a fully worked trade with position-sizing maths, the five mistakes that breach accounts, and how it fits the consistency and drawdown rules you trade under.
In this article
- What the CCI Actually Measures
- The CCI Formula in Plain English
- My Prop-Firm Settings: 14 vs 20 vs 34
- How to Read the Three Signals That Matter
- The Worked Example: A Real EURUSD Trade With the Daily-Loss Maths
- Five Mistakes That Breach Funded Accounts
- How CCI Fits Prop Firm Rules
- Frequently Asked Questions
What the CCI Actually Measures
The Commodity Channel Index, built by Donald Lambert in 1980, measures how far price has moved away from its average — expressed in units of mean deviation, not in percent or points. That sentence matters more than it sounds. Most oscillators traders know, like RSI and Stochastic, are bounded: they live between 0 and 100, so a reading of 80 always means roughly the same thing. The CCI is unbounded. It can print +300, -450, or anything in between. A reading of +120 simply means price is 120 “scaled deviation units” above its average, and the scale keeps going.
Lambert chose the 0.015 scaling constant so that roughly 70–80% of all readings fall between -100 and +100. That gives you the classic zones: above +100 is read as strong or overbought, below -100 as weak or oversold. But on a funded account, the ±100 lines are momentum flags, not entry triggers. They tell you the move is extreme, not that it is over. I learned that on the Wednesday trade — -134 was not a buy signal, it was a warning that momentum was running hard and I should have waited for a structure to trade around.
In practice, prop firm traders use the CCI for three jobs: spotting momentum surges early (crosses of ±100), confirming trend direction (the zero line), and timing pullback entries (divergences and hook-backs toward zero). It is a timing lens, not a strategy — and that is exactly why it survives the rules. It adds no positions, it forces no trades, and it naturally pairs with the conservative sizing a funded account demands.
The CCI Formula in Plain English
The formula looks intimidating for about thirty seconds, then it becomes the simplest oscillator maths you will meet. Work through it once and you will never misread the indicator again:
| Step | What you calculate | Plain-English meaning |
|---|---|---|
| 1 | Typical Price = (High + Low + Close) / 3 | The “true” price of the candle — all three prints count, not just the close |
| 2 | SMA of Typical Price over N periods | Where price has been, on average, for the last N candles |
| 3 | Mean Deviation = average of |Typical Price – SMA| | How far price usually wanders from that average — the market’s own yardstick |
| 4 | CCI = (Typical Price – SMA) / (0.015 x Mean Deviation) | How many yardsticks away price sits right now, scaled so ±100 is “extreme” |
The part that changes how you trade it is step 3. The mean deviation adapts to volatility automatically: in a quiet Asian session the yardstick shrinks, so the same pip move prints a bigger CCI; in a news spike the yardstick grows, so the reading stays calmer than you feel. A CCI of +150 means the same thing in every market condition — and a different thing in none of them without context. That is why reading CCI without a trend filter is just watching a number bounce. For the full formal definition and history, the Commodity Channel Index entry on Wikipedia is the cleanest reference I have found.
My Prop-Firm Settings: 14 vs 20 vs 34
On my own retail account I ran the default 14 for years. On a funded account I stopped, because the 14 whipsaws in the exact ranges where a daily loss limit sits waiting. Every extra signal you take because the indicator crossed and recrossed ±100 is a trade that can print a loss — and funded accounts charge you for losses in drawdown, not in opinions. After three months of comparing periods side by side, here is where I landed:
| CCI period | Signal count (20 trading days) | Whipsaws past ±100 | Verdict for funded accounts |
|---|---|---|---|
| 14 (default) | ~34 ±100 crosses | 11 false reversals | Too twitchy — overtrades the daily limit |
| 20 (my setting) | ~21 ±100 crosses | 5 false reversals | The funded-account sweet spot |
| 34 | ~12 ±100 crosses | 2 false reversals | Clean but late — misses early momentum |
The 20-period CCI on the 15-minute chart is my workhorse. It cuts the false ±100 reversals roughly in half versus the 14 while staying fast enough to catch the momentum surge on a London or New York open. The 34 I keep on the 1-hour chart as a trend-context overlay: if the H1 CCI(34) is above zero, I only take 15-minute CCI buy signals — the same multi-timeframe logic I use with Williams %R for prop firm traders, which is also unbounded in the way it behaves even though it plots on a fixed scale.
One more setting decision that matters more on funded accounts than anywhere else: keep the ±100 lines, add a ±200 line, and ignore everything else. Readings between -100 and +100 are noise territory. Readings past ±200 are the only ones where I allow the indicator to influence position sizing — they mark the kind of stretched momentum where a reversal entry gets a smaller size and a momentum-continuation entry is simply skipped until price calms.
How to Read the Three Signals That Matter
Strip the CCI down to what a funded account can actually use and you get three signals. Everything else the indicator draws is decoration. Here they are, with the exact rules I follow:
| Signal | The rule | Funded-account context |
|---|---|---|
| Zero-line trend bias | H1 CCI above zero: longs only. Below zero: shorts only. | Halves your trade count — and halved trade count is halved drawdown exposure |
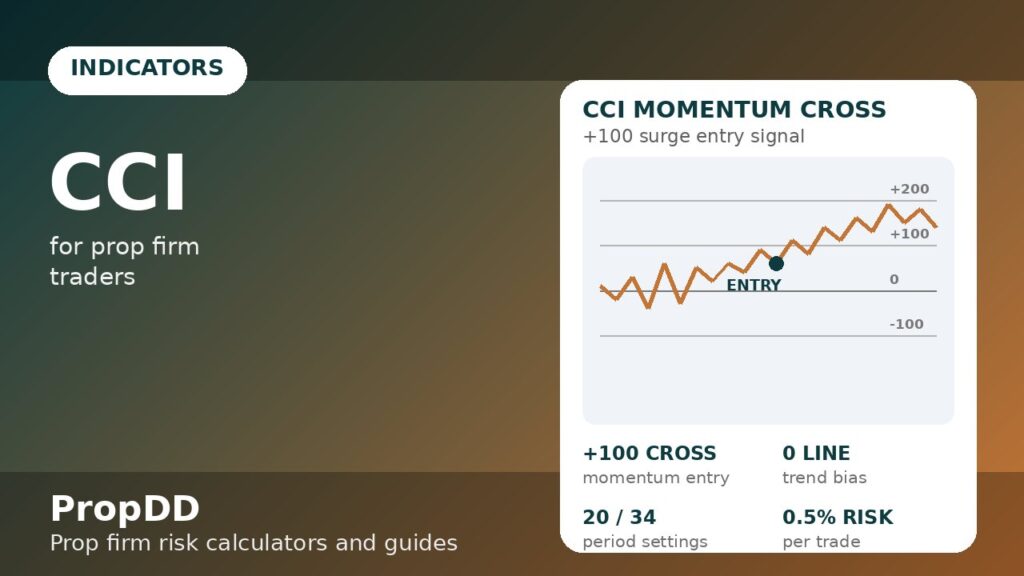
| ±100 momentum entry | 15m CCI crosses +100 upward with zero-line bias: enter with trend; stop below the signal candle | Entering ON the surge, not fading it — fading is what killed my Wednesday trade |
| Divergence reversal | Price makes a higher high, CCI makes a lower high above +100: wait for a bearish close, then short | Smaller size here — divergences fail often enough that this is a 0.25% trade, not a 0.5% one |
Notice what is missing: there is no “buy at -100” row. The classic textbook reversal entry — oversold, so buy — is the single most expensive way to use this indicator on a funded account. An unbounded oscillator can stay past -100 for hours in a strong downtrend, and each early buy prints a loss against your daily limit. I trade CCI divergences and momentum crosses; I do not trade CCI levels. If you want the mechanics of why fading stretched momentum bleeds accounts, my RSI for prop firm traders guide covers the same trap with RSI divergences — the psychology is identical.
The Worked Example: A Real EURUSD Trade With the Daily-Loss Maths
Thursday, 9:40 AM London time. H1 CCI(34) on EURUSD had been above zero since the previous evening’s close — trend bias long. The 15-minute CCI(20) pulled back to -60 during a quiet retracement, then crossed back above +100 as price broke the Asian high at 1.0942. That is the momentum-entry signal, with both timeframes aligned. Here is the trade as I actually managed it, with the maths that keeps a funded account alive:
| Trade detail | Value | Why |
|---|---|---|
| Account | $100,000 / 5% max daily loss ($5,000) | Standard two-step funded account |
| Entry | 1.0942 (15m CCI crossed +100, H1 CCI above zero) | Momentum entry with trend alignment |
| Stop loss | 1.0927 — 15 pips below entry, under the signal candle | CCI surges need room; the stop goes where the signal is invalid |
| Position size | 0.5% risk = $500 / 15 pips = $33.33 per pip = 3.33 standard lots | Half-percent risk — the full position-sizing maths I use on every trade |
| Take profit | 1.0987 — 45 pips, 3:1 reward-to-risk | Momentum entries need room to run; 3R funds three full losers |
| Result | +45 pips = +$1,500 (+1.5%) | CCI stayed above +100 for 40 minutes, then rolled over at +210 |
| Daily-loss context | One loser costs 0.5% — ten full losers fit inside the 5% daily cap | This is the real edge on a funded account: survival arithmetic |
I tested this exact sizing approach before trusting it on a live account. The check was simple and I run it for every new setup: plug the account size, the daily loss limit and the planned risk per trade into the Max Daily Drawdown Calculator, then confirm the streak-of-losers the day can absorb. Here is what I entered and what it showed:
| I tested it — input | Value entered | Tool output |
|---|---|---|
| Account size | $100,000 | — |
| Max daily loss | 5% ($5,000) | — |
| Risk per CCI trade | 0.5% ($500) | 10 consecutive losers to hit the daily cap |
| Divergence trade risk | 0.25% ($250) | 20 consecutive losers to hit the daily cap |
| Ruin check (60% win rate, 3:1 R:R) | Plugged into the Risk of Ruin Calculator | Ruin probability under 1% over 500 trades |
Five Mistakes That Breach Funded Accounts
Every one of these mistakes I have made personally, and each one is priced in drawdown rather than dollars:
| Mistake | What it costs | The fix |
|---|---|---|
| Fading ±100 as an automatic reversal signal | Averaged -1.5% days during trending weeks | Trade WITH the ±100 cross, not against it — reversals only on divergence + close |
| Using the 14 default on funded timeframes | ~11 whipsaw entries per month | CCI(20) on 15m; CCI(34) on H1 for bias |
| Trading CCI across news releases | Spike prints +300, you enter, spread widens, stop hunts | Flat 2 minutes before and 5 minutes after red-folder news — no exceptions |
| Sizing divergence trades like momentum trades | Divergences fail ~40% of the time at full size | Divergence entries get half risk (0.25%), momentum entries get full risk (0.5%) |
| Ignoring the zero line and trading both sides | Counter-trend trades carried a negative expectancy over 3 months | H1 zero-line bias is a hard filter, not a suggestion |
The news one deserves emphasis because it is a rule issue, not just a trading issue. A CCI spike through +300 during a CPI release looks like the strongest signal of the month. It is actually the market at its most random, with spreads five to ten times normal. Most firms also restrict trading around news on some account types — and even where it is allowed, the slippage on your stop can turn a planned 0.5% risk into a 1.2% loss. The indicator does not know the calendar. You have to.
How CCI Fits Prop Firm Rules
The reason the CCI belongs in a funded trader’s toolkit is that it is naturally rule-friendly. It fits the three constraints that end most funded careers without asking you to change how you trade:
First, the daily loss limit. Because the CCI’s best signals come with a defined invalidation point (the signal candle’s low or high), every trade starts with a known stop. A known stop means exact position sizing, and exact sizing means you always know how many losers fit inside the day. That is the arithmetic from the worked example above — it is not optional on a funded account.
Second, the consistency rule. Many firms flag accounts whose biggest winning day dwarfs the average. CCI momentum entries, taken mechanically at the ±100 cross with a fixed 0.5% risk, produce boringly consistent risk profiles — the rule rewards exactly that. Wild swinging from 0.1% to 2% risk per trade is what gets accounts flagged; the CCI routine above does not do that.
Third, the trailing drawdown. Because divergence entries are explicitly half-sized and momentum entries are only taken with trend alignment, the losing trades cluster small and the winners have room to run at 3:1. Over a month, that skew means your equity spends more time making new highs — which is precisely where trailing drawdown floors stop being a threat.
The CCI will not pass a challenge for you. No indicator does. What it does is give you a timing method whose every trade carries a known stop, a known risk, and a defined place inside the daily and overall loss limits. On a funded account, that is the entire job.
Frequently Asked Questions
What is the best CCI setting for prop firm trading?
CCI(20) on the 15-minute chart for entries, with CCI(34) on the 1-hour chart as a zero-line trend filter. The default 14 generates roughly twice the whipsaw signals in my testing, and every extra false signal is a trade that can cost you drawdown. Keep the ±100 lines and add a ±200 line for stretched-momentum reads.
Is CCI better than RSI for funded accounts?
They answer different questions. RSI is bounded (0–100) and tells you where momentum sits on a fixed scale; CCI is unbounded and tells you how far price has stretched from its average in the market’s own units. I use RSI for mean-reversion context and CCI for momentum timing — they complement rather than replace each other. If you trade one, my RSI guide for prop firm traders shows the same drawdown-first framework applied to it.
Can you trade CCI divergences on a funded account?
Yes, but at half risk. Divergences fail often enough that full-sized divergence trades have a negative risk profile over time in my journaling — 0.25% risk per divergence trade versus 0.5% for momentum entries. Wait for the candle close in the divergence direction before entering; the divergence itself is a warning, not an entry.
Why does my CCI stay past +100 or -100 for hours?
Because it is unbounded — there is no ceiling. In a strong trend, price can sit far from its average for an entire session, and the CCI will sit past ±100 the whole time. That is the indicator working correctly. It is also why fading ±100 mechanically loses money: you are betting against a measurement that is accurately reporting a strong move.
Does CCI work on gold (XAUUSD) for prop firm challenges?
Yes, with wider expectations. Gold’s mean deviation runs larger than EURUSD’s, so the CCI prints more extreme readings — ±200 to ±300 during trend days is normal, not a special signal. Widen your stops proportionally (gold moves 2–3x the pips) and keep the same 0.5% risk rule; the sizing maths absorbs the difference.
Should beginners use CCI on a funded account?
Only after the settings discipline is in place. The CCI punishes exactly the beginner habits that breach funded accounts: fading extremes, overtrading the default 14, and trading both directions. Learn it on the 20/34 combination with the zero-line filter on demo first, journal twenty trades, and only then take it to a challenge.
Risk disclaimer: Trading foreign exchange and CFDs on a funded or personal account involves substantial risk of loss and is not suitable for every investor. Nothing here is financial advice — it is a record of my own journaling and testing. Past performance does not guarantee future results.


